
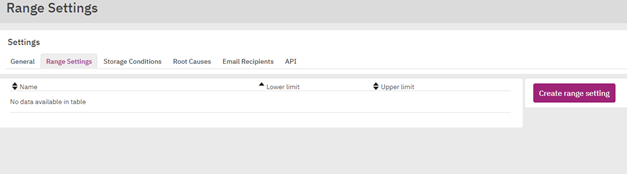
Range Settings Temperature y-scale for Graph View
A user with the right to the site settings can define upper and lower limits for the graph (y-scale) to make it easier to compare different reports side by side.
Fields that should be provided:
- name for the template
- lower limit (optional)
- upper limit (optional)
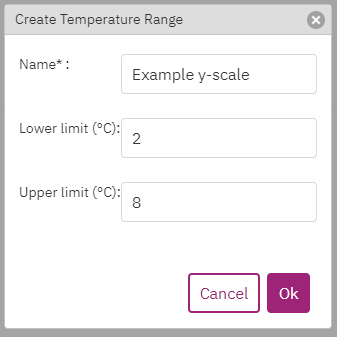
At least one of the limits should be filled in. Ranges are set on the basis of the user settings (F or °C).
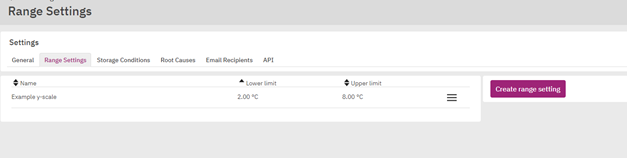
Max. amount of the range is 10.
Feedback
Copyright © 2025 Berlinger & Co. AG
—
Powered by 
Post your comment on this topic.