
- Overview
-
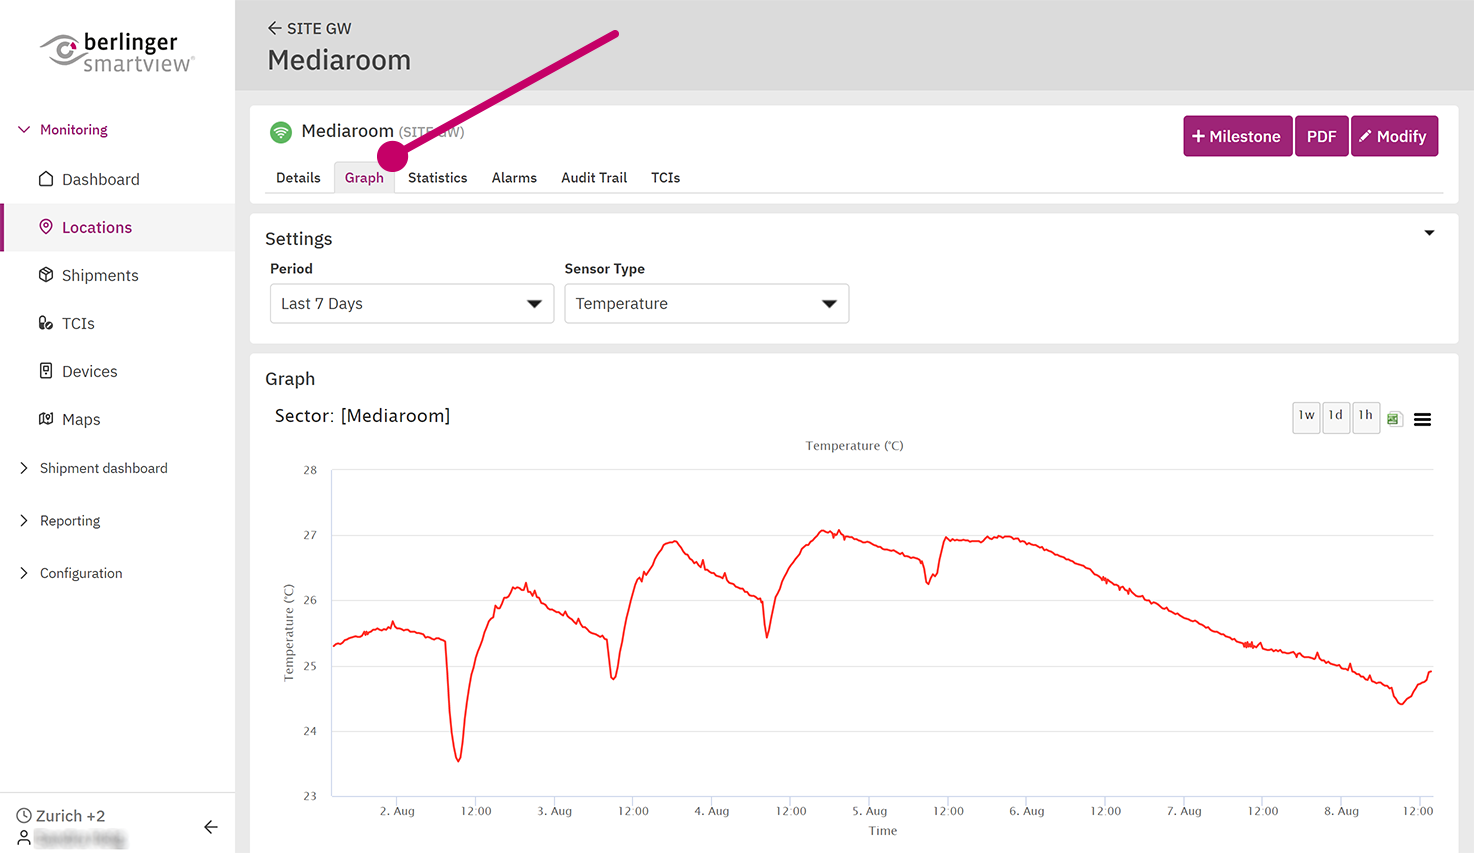
SmartView offers possibilities to present captured data in several graphs.
Overview
![]()
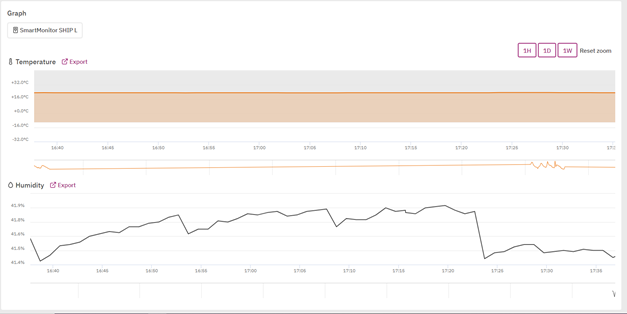
*An additional view of a graph is also visible within the view of the devices.
![]()
- Settings
-
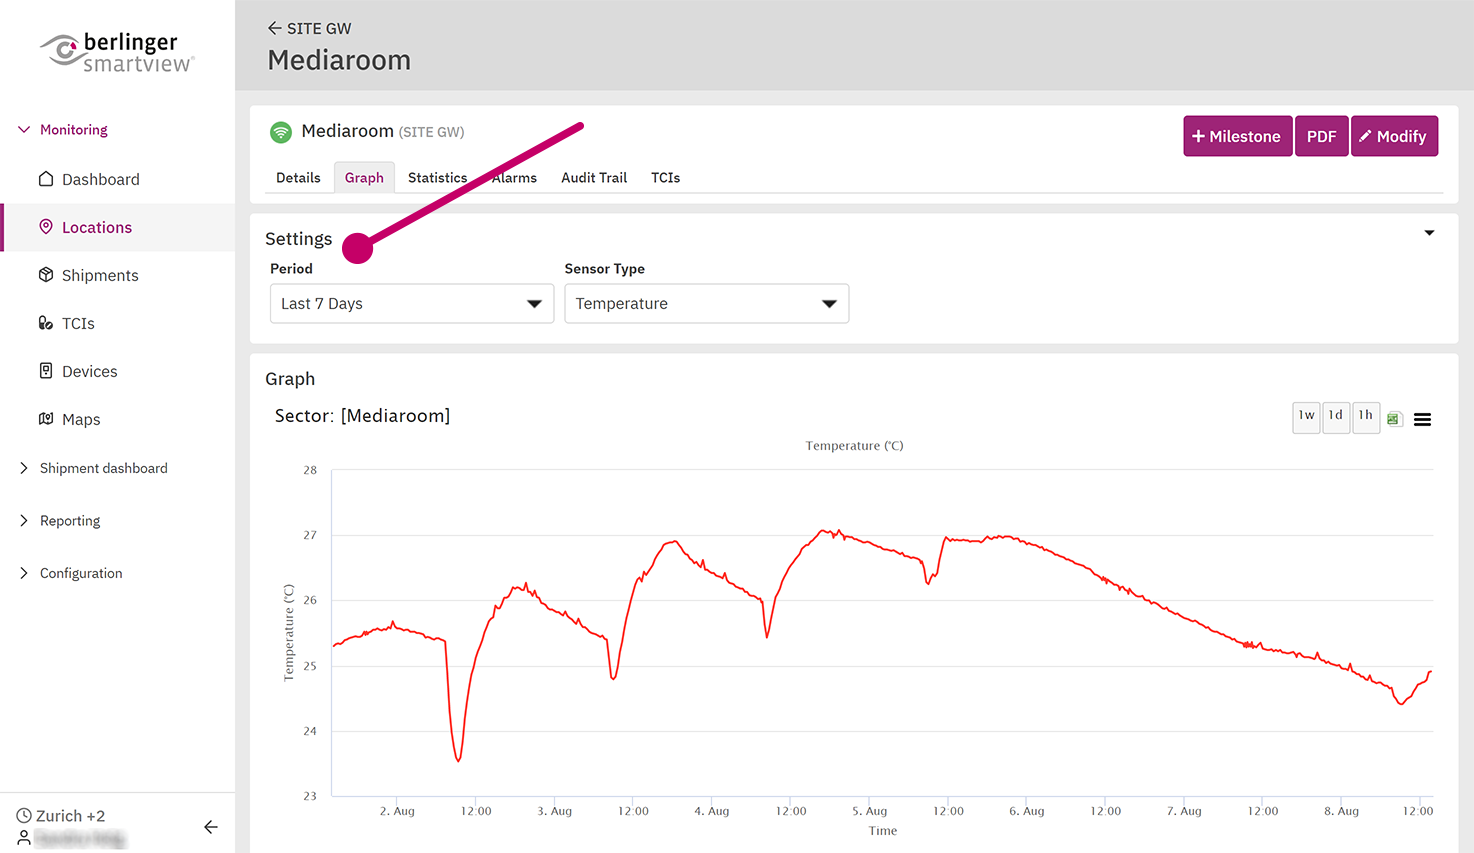
Settings
![]()
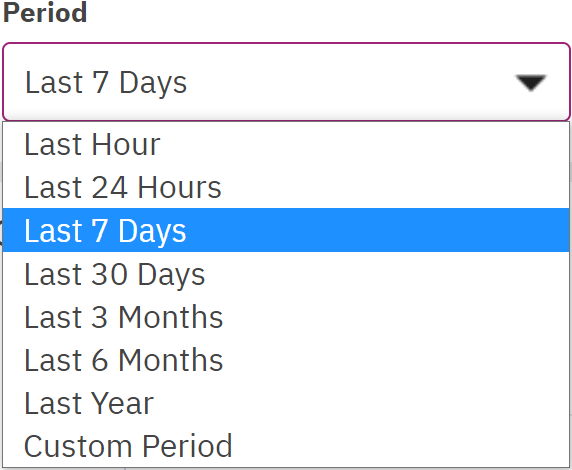
Period:
Choose the time period which should be displayed
![]()
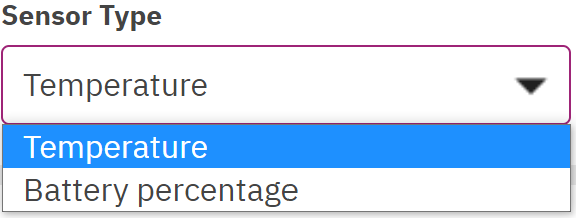
Sensor Type:
Choose the type of sensor which should be shown on the graph if available
![]()
- Graph
-
Graph
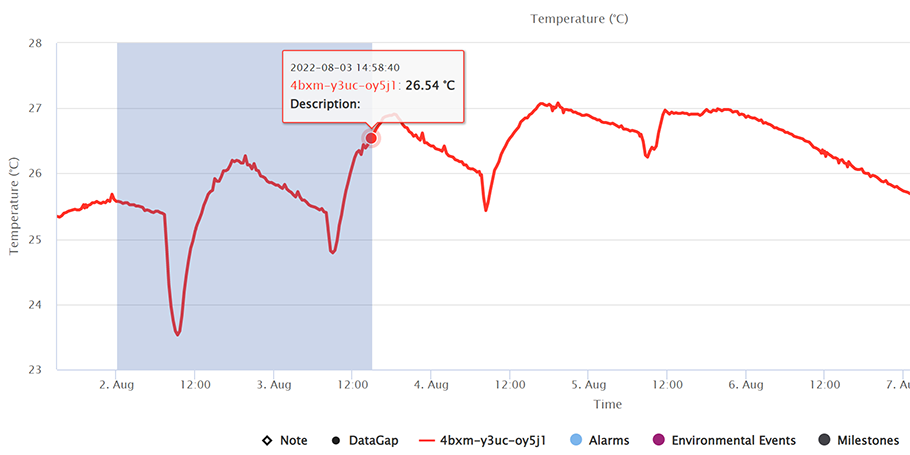
Displays the graph with the following settings:
![]()
Show the behavior of the last hour / day / week on the graph
![]()
Export CSV file that contains the raw data of the measurements displayed within the graph
![]()
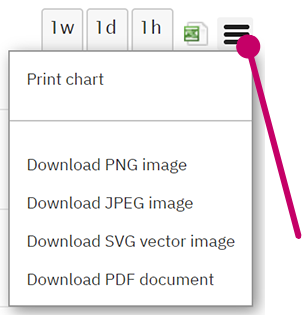
Print chart or download different image types for presentations
![]()
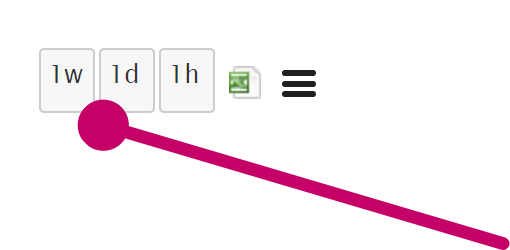
Choose (mark) x-scale of graph view
By clicking into the graph, holding down the left mouse button, dragging along the x-scale and releasing the mouse button you can zoom in into the part you have chosen.
![]()
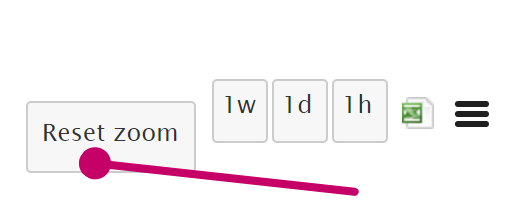
Press the Reset zoom button to get back to the initial position
![]()
- Creating a PDF
-
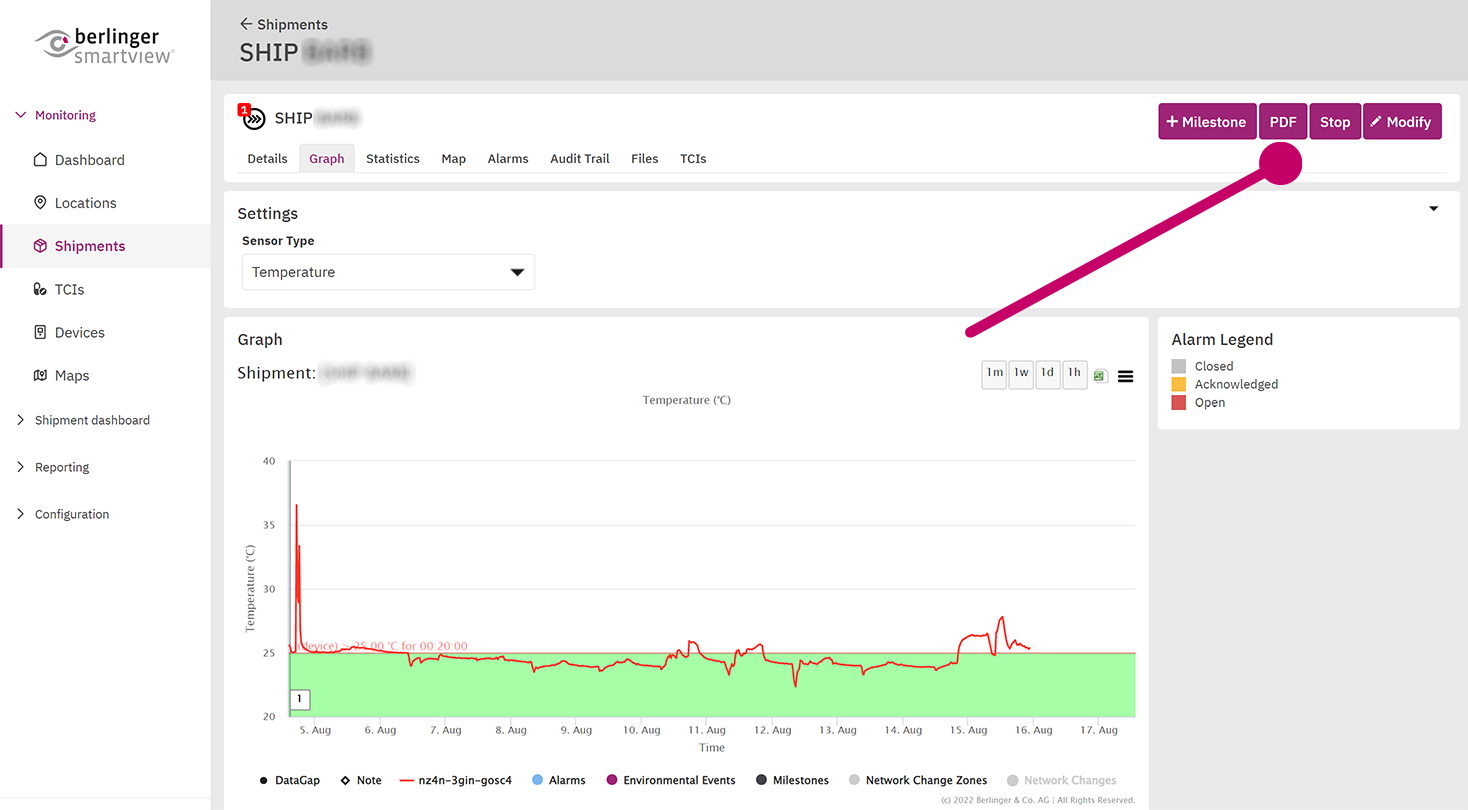
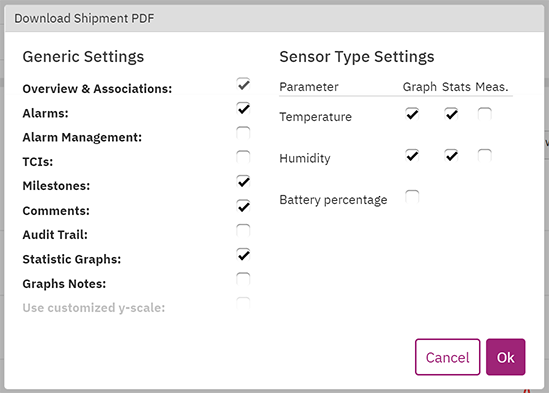
h2. Creating a PDF
![]()
![]()
- Create Note on the Graph
-
Create Note on the Graph
You can click on the graph and a new pop up window will open.
![]()
![]()
The note will by shown on the graph by a blue rhomb. You can click on it and the notes window will be opened.
![]()
In the PDF report you have an option whether to export Graph Notes or not.
![]()
- Excursion Legend
-
Excursion Legend
![]()
For more information in regard of excursion follow this link: Excursions - Relevant Time
-
Relevant Time (Only applicable within shipments)
You can modify (not delete or change) the relevant time of your shipment, so that in the graph only the relevant information is shown.
Example: If your shipment arrived at the destination and the data logger was taken off the product and carried into an office, but someone forgot to stop the device.
Now it can happen that an excursion has been generated. If that is not relevant for your report anymore you can change the Relevant Time, so that only the useful information stays available.
Further information in that regard can be accessed under the following chapter: Shipment Relevant Time


Copyright © 2025 Berlinger & Co. AG
—
Powered by 
Post your comment on this topic.