
The Analytics Dashboards page provides a consolidated view of key business metrics in one place. The dashboards are segmented into cards and rows. Each row can contain 4 cards or two graphs, each tracking a different business metric.
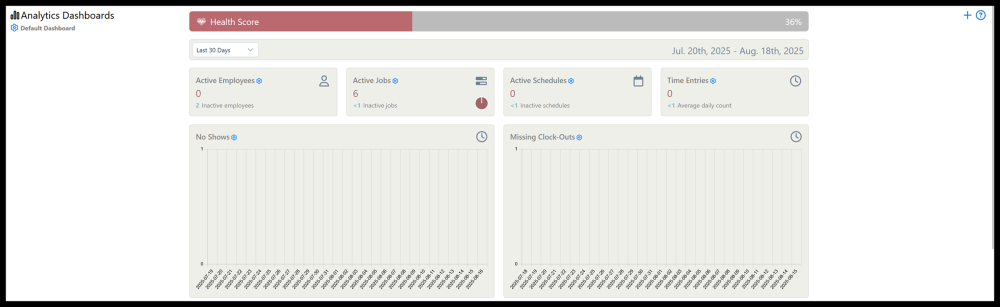
By default, metrics tracked includes Active employees, jobs, schedules, and time entries. It also shows a record of No shows, missing clock outs, and employee and supervisor notifications.
Highlights of The Analytics Dashboard Page
To access the Analytics Dashboards, click on the rocket menu  icon in the top left corner and select Analytics Dashboards.
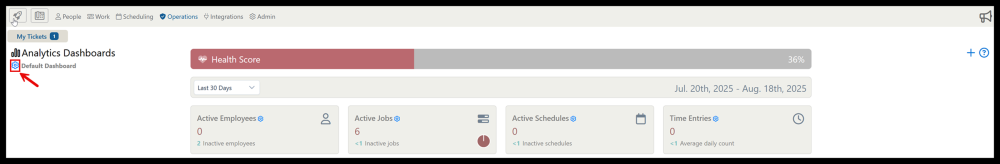
1. Click the gear ![]() icon brings up a menu where you can add, edit, rename, clone, reset, and delete dashboard elements.
icon brings up a menu where you can add, edit, rename, clone, reset, and delete dashboard elements.
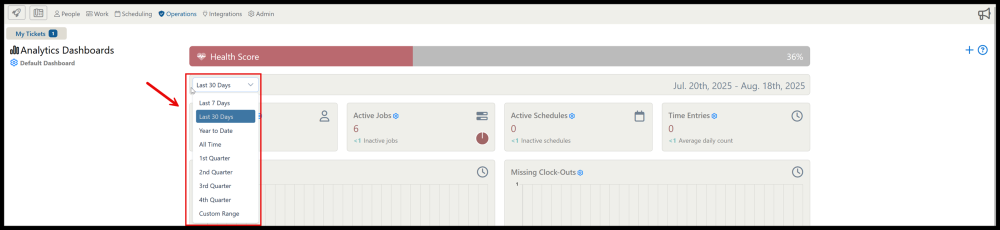
2. Analytics tracking can be set to custom date ranges using the drop-down menu.
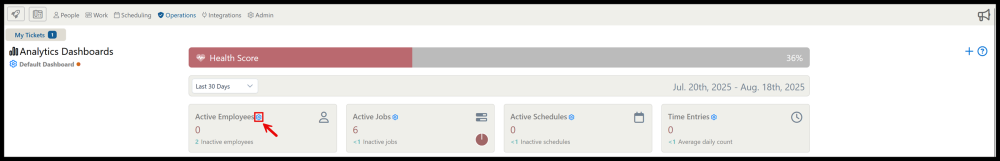
3. Clicking the gear ![]() icon on any dashboard card brings up a menu with card options including adding and removing and adding a data source.
icon on any dashboard card brings up a menu with card options including adding and removing and adding a data source.
Need more help with this?
Telephone Timesheets Support