
QP20 – Sold vs Unsold Properties – Question suspended until report is approved (68OS 2829) The Assessor will create a report from the CAMA system that will randomly select a subdivision or market area (neighborhood) from the current year’s ratio study and make a Property Profile Study or equivalent report of residential properties, and compare the median value change of the sold and unsold properties to verify the County is properly valuing property annually. The Median should be divided against each other to create a percentage… (Copied from the 2023 Performance Audit Updated July 12, 2023)
Main Menu — Sales — Property Profile
The Property Profile Study window will open.
CHOOSE Subdivision or Neighborhood Range
TYPE-IN the code range that covers the area in the county you wish to cover. (User my need to look at the Neighborhood or Subdivision tables to determine the code range desired.) This works like a range in an index, therefore put the lowest number with two decimals between Ex: 1..1000000
FILL-IN the desired study options and CLICK Start
The report will generate.

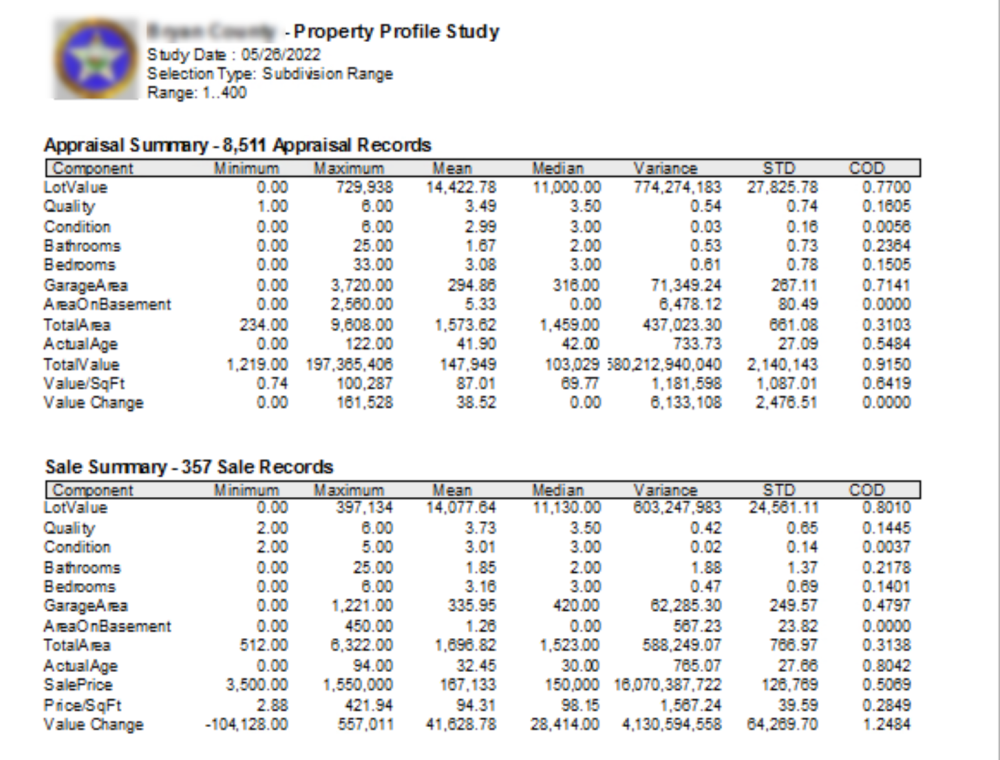

Post your comment on this topic.