EXECUTIVE VIEW REPORTING PREFACE
Executive View reporting allows a user with multiple sites to see aggregated data for all sites within his/her network. The Executive View module saves the user time by giving him/her multiple ways to easily analyze sales performance and/or trends, track item sales, measure one store’s performance over another, for all or selected sites, at one time. In this module, you will learn about:
- Executive View Reporting – An Overview
- Executive View Reports Snapshot
- How to navigate to the executive view reports
- Group Creation – An Overview
EXECUTIVE VIEW REPORTING – AN OVERVIEW
You will have the ability to view aggregated sales data in a variety of ways within Console. Executive View report features include the ability to filter by assigned groups, add chart data, drill down for more detailed information and export reports to excel.
The Executive View reports can be filtered by groupings created by the user. The header columns for the first column and row on the Summary, Labor, and Comps & Promos reports are locked, making it easier to see metrics for sites further down the page.
EXECUTIVE VIEW REPORTS SNAPSHOT
The reports included in the Executive View include:
- Sales: Allows you to view sales by hour, day, week, month, or period, for any given period of time. You can also compare current sales to previous years with a click of a button. Note that comparisons are based off of a same day metrics (not same date)
- Product Mix: Allows you to view product sales by category or department for any given period of time
- Modifiers: Allows you to view a detailed summary of item modifiers that are used in the sales transactions for any given period of time
- Comps and Promos: Allows you to view comps and promos for any given period of time. You can view by comp, select the comp and see a breakdown of comp by store; or change the way you view the Comps & Promos report to view “by store”, which enables you to analyze the comps applied against the stores. Note that PY comparisons are based off of same day vs. dame date
- Summary: The summary report provides a site by site comparison of current and prior year sales, guest counts, average ticket totals, labor costs and labor cost percentages
- Custom Summary: The custom summary report allows you to create custom reports based off of available metrics and it includes the ability to share those reports with other users within your network
- Labor: The Labor summary report allows you to compare labor hours, labor costs and labor cost percentages for all sites within one report
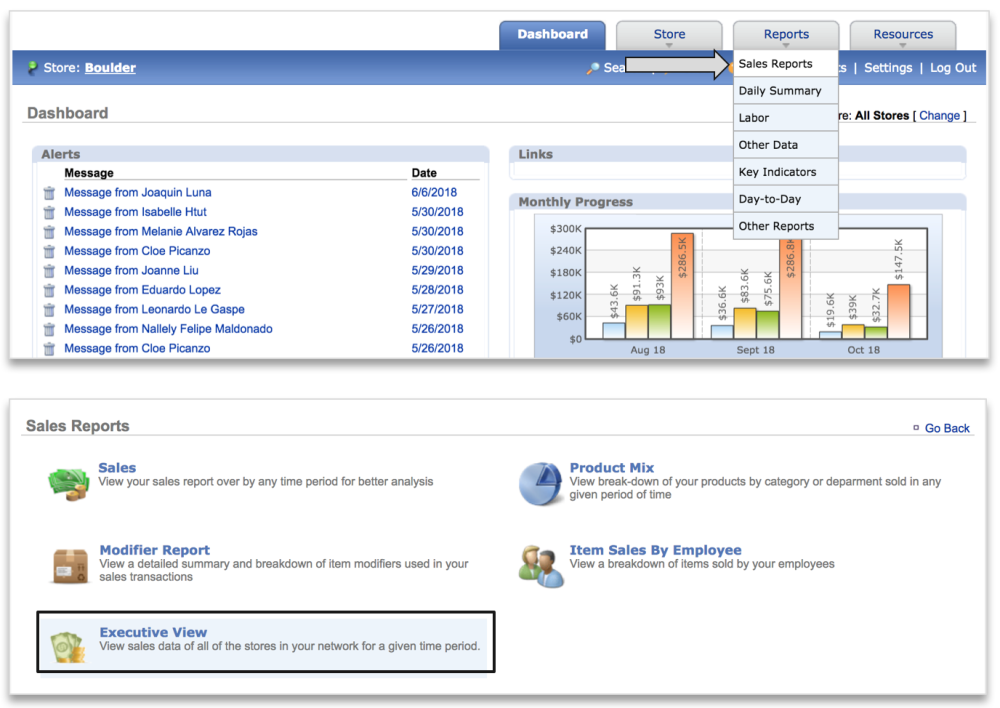
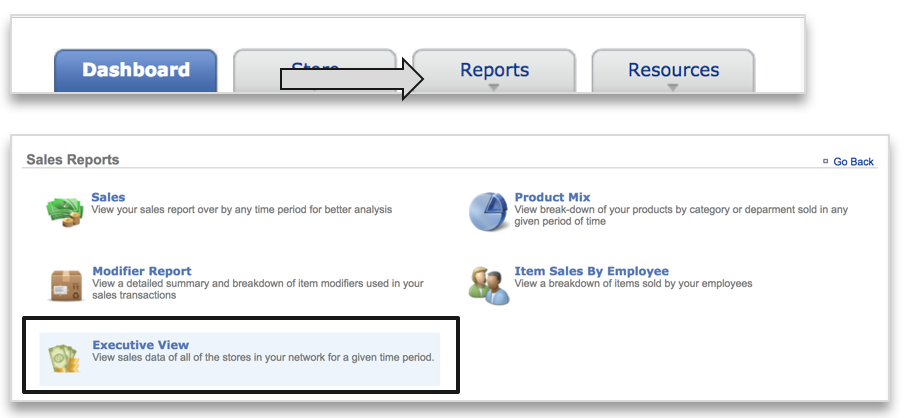
TO NAVIGATE TO THE EXECUTIVE VIEW REPORTS
- Mouse over to the Reports tab
- Click Sales Reports
- Click Executive View
- You can also click Reports > Sales Reports > Executive View
- Select the Executive View report you wish to navigate to
GROUP CREATION – AN OVERVIEW
Within Executive View reporting, you will have the ability to create up to five Groups that contain any number of sub-groups. These sub-groupings can be assigned to the sites with your network. This will allow you to filter Executive View reports based on those assignments. The Managing Groups training module will review the following topics:
- How to create new Groups
- How to modify existing Groups
- How to delete a Group
- How to add Sub-Groups to Groups
- How to edit or delete a Sub-Group
- How to assign Groups to sites
Click here to navigate to the Managing Groups training module.


