EXECUTIVE VIEW SALES REPORTS PREFACE
The Executive View Sales Reports allows a user with multiple sites to see aggregated sales data for all sites within their network. This includes average hourly sales, daily sales, monthly sales and by period sales data. In this module, you will learn about:
- How to navigate to the Executive View Sales report
- Executive View report features
- Available Executive View Sales reports
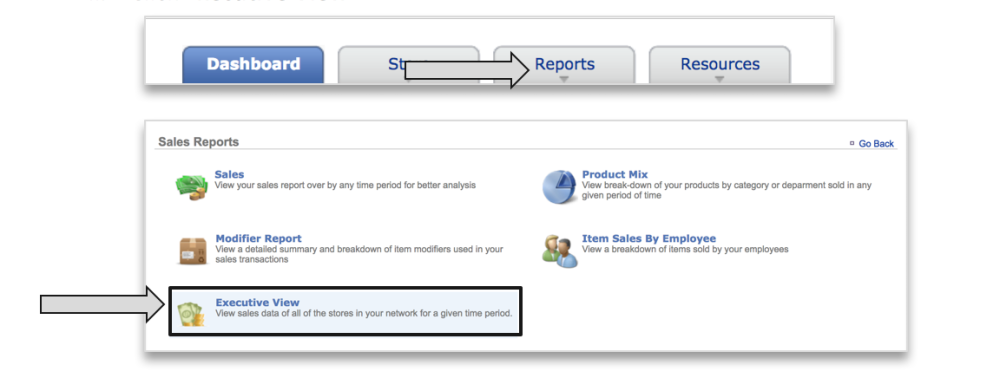
TO NAVIGATE TO THE EXECUTIVE VIEW SALES REPORT
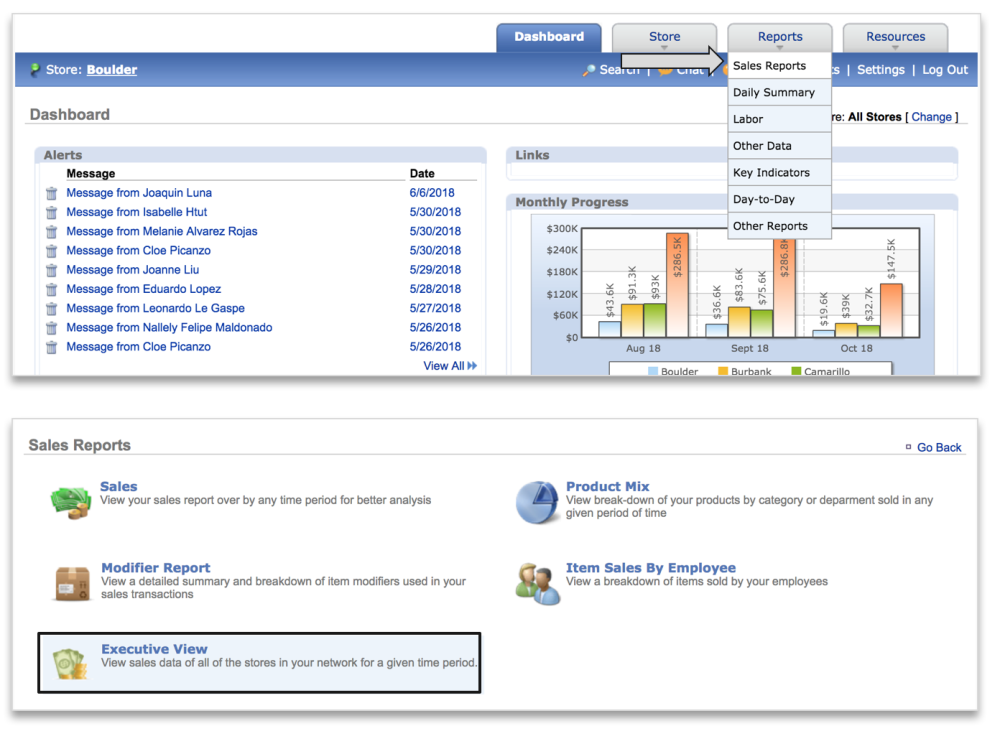
- Mouse over to the Reports tab
- Click Sales Reports
- Click Executive View
![]()
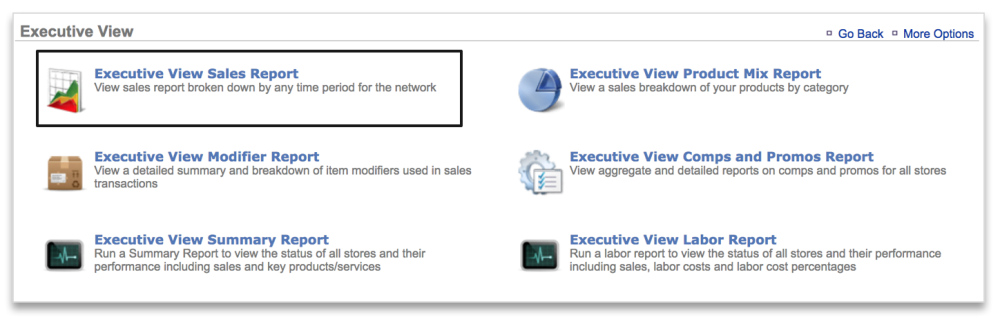
- You can also click Reports > Sales Reports > Executive View
![]()
- Click Executive View Sales Report
![]()
EXECUTIVE VIEW SALES REPORT FEATURES
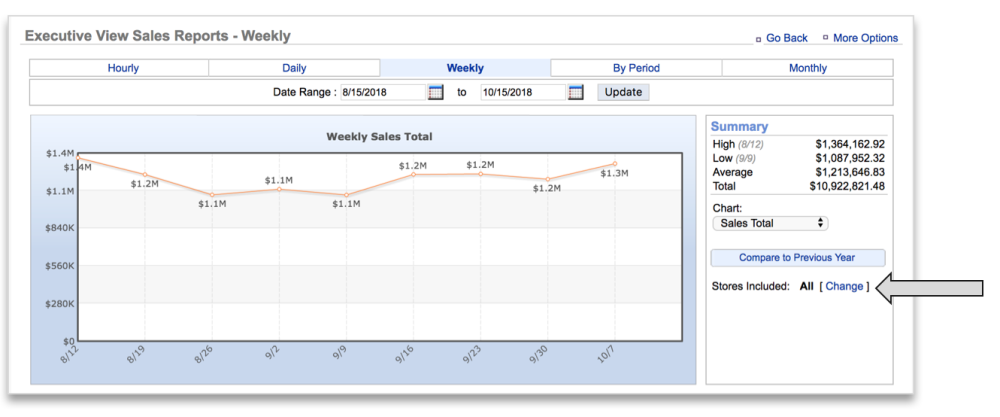
The Executive View Sales Reports will default to the Weekly view. Click the tabs along the top of the page to navigate to the other Executive View sales reports (Average Hourly, Daily, By Period or By Month).
- To export any Executive View sales report, click More Options at the top right corner of the page
- Click Export
- Results will be exported to a CSV file that can be opened in Excel
- Click Compare to Previous Year to add prior year (PY) data to the chart. PY data will always be shown within the detail below the chart. Note that PY calculations are based off same day vs. same date comparisons. This means that when comparing prior year data for Monday, January 1, 2018, you’ll be seeing PY metrics for Monday, January 2, 2017 vs. Sunday, January 1, 2017 in the reports
![]()
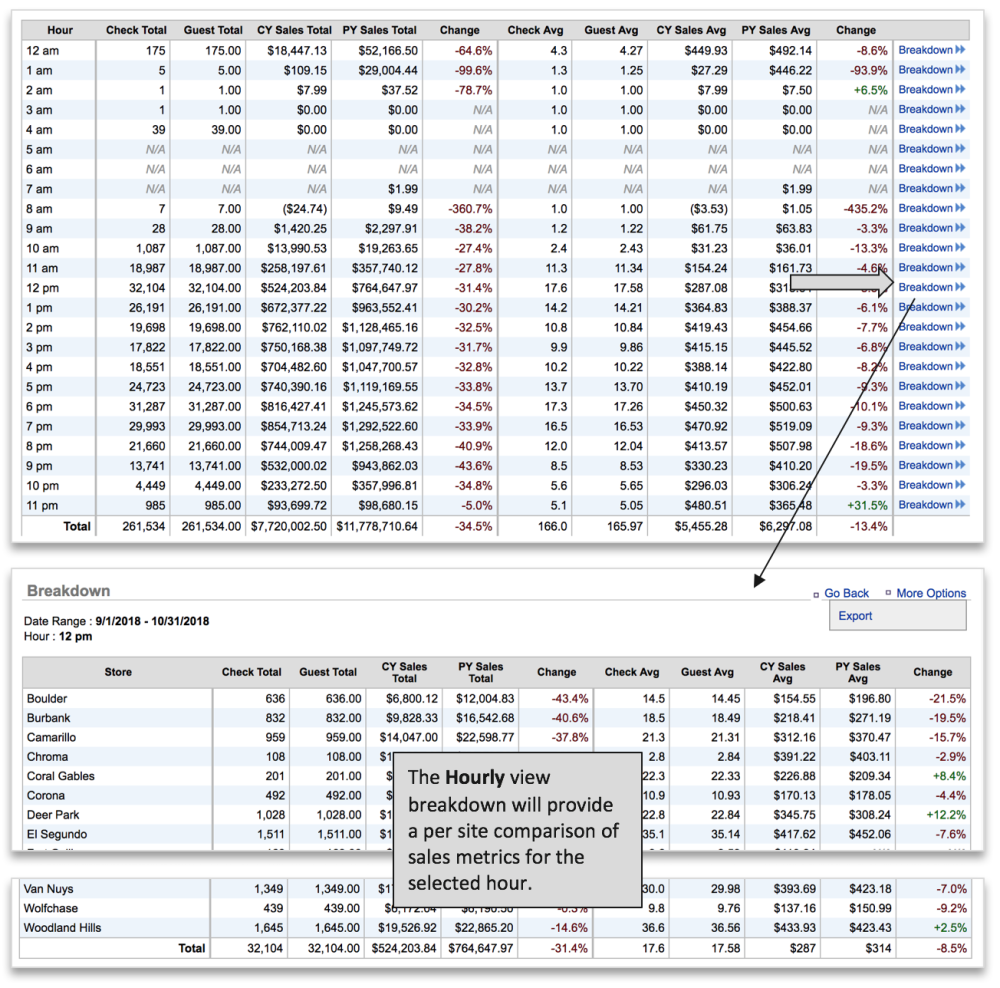
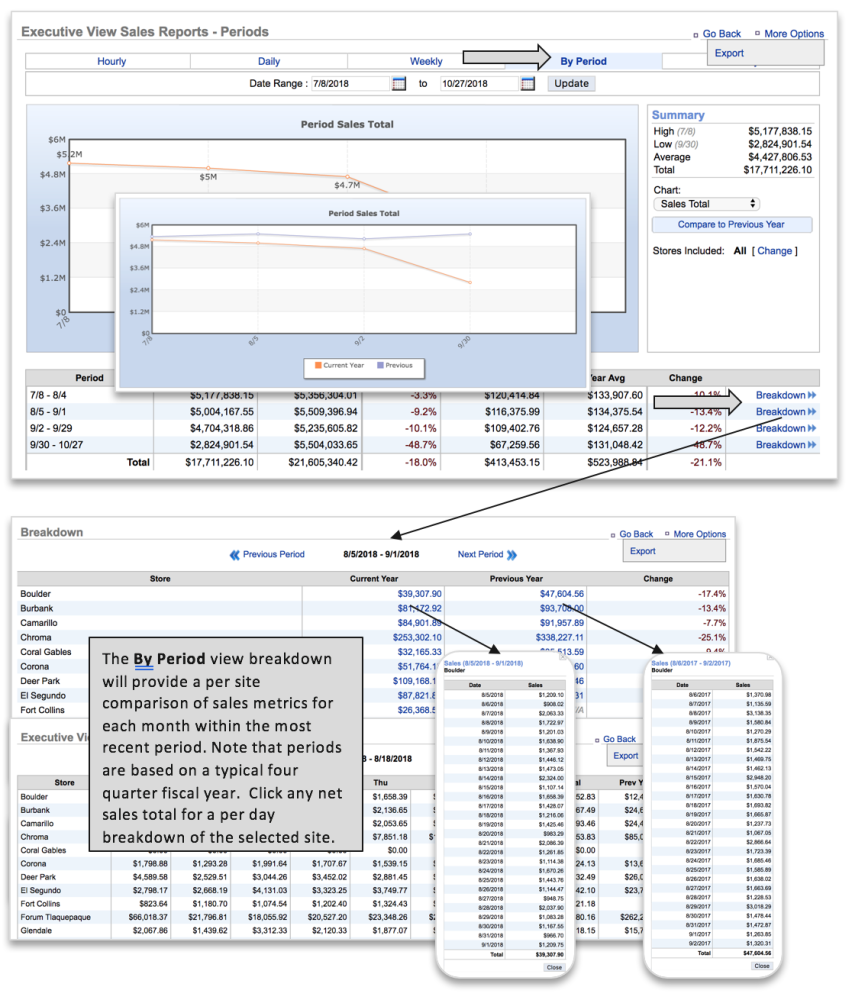
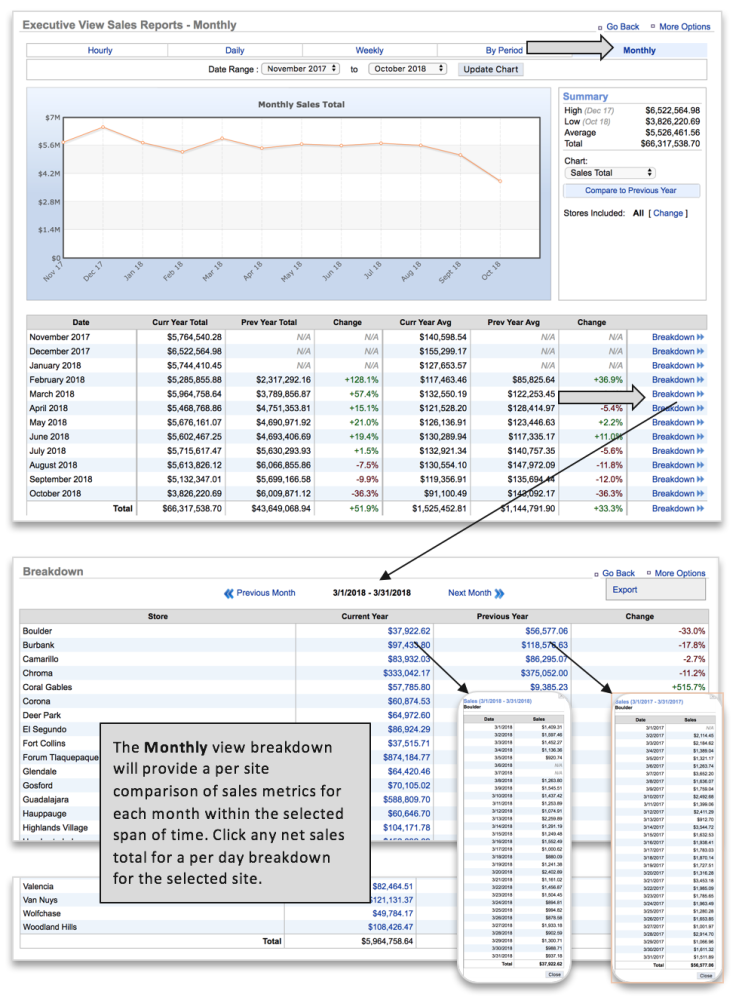
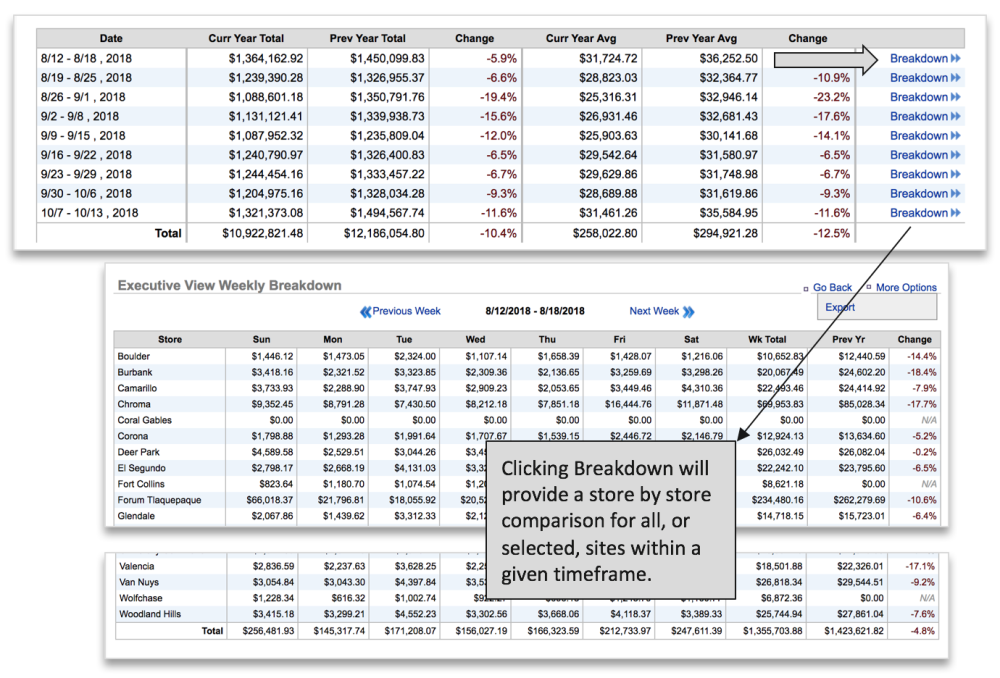
- Click Breakdown to see how your sites compare to one another for the time frame selected.
![]()
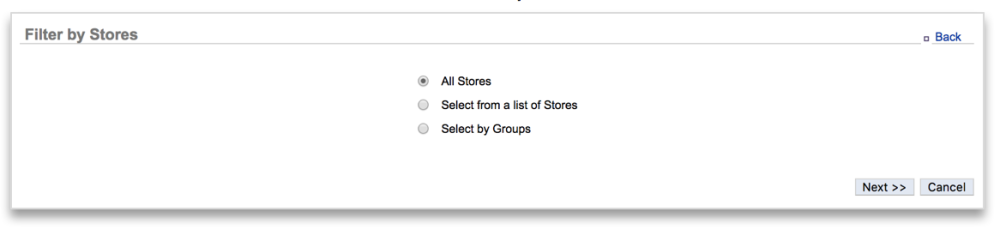
- Click Change to the right of Stores _Included _to filter the report by store or Group
![]()
- Click All Stores to view metrics for all sites within your network
![]()
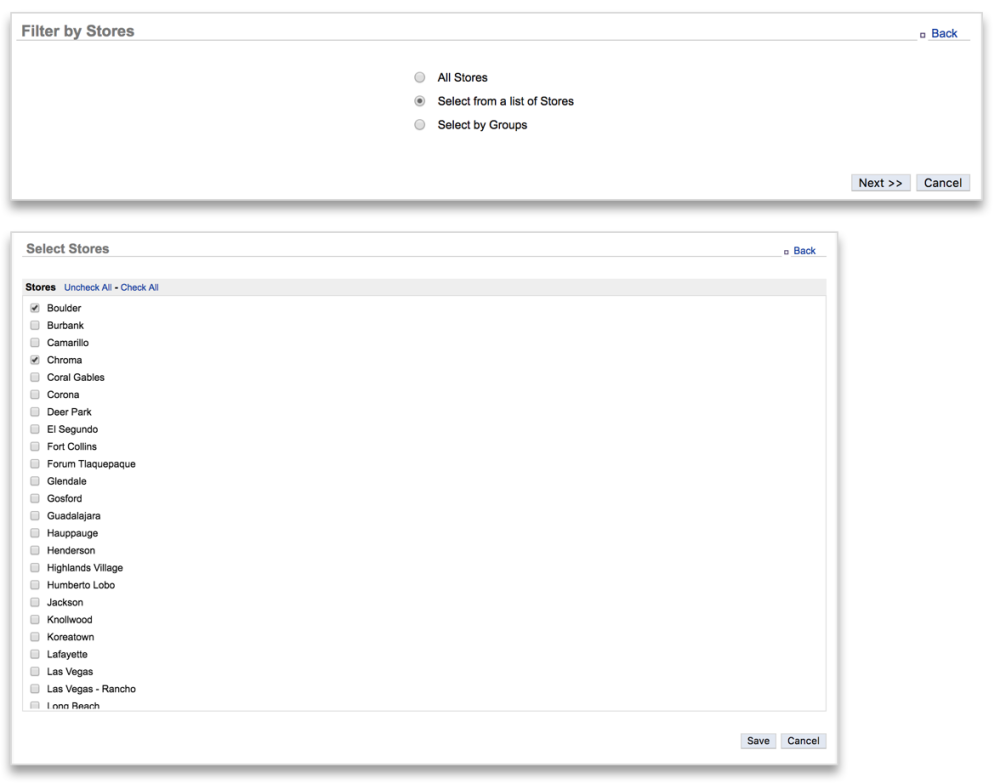
- Click Select from a list Stores to select specific sites from within your network
![]()
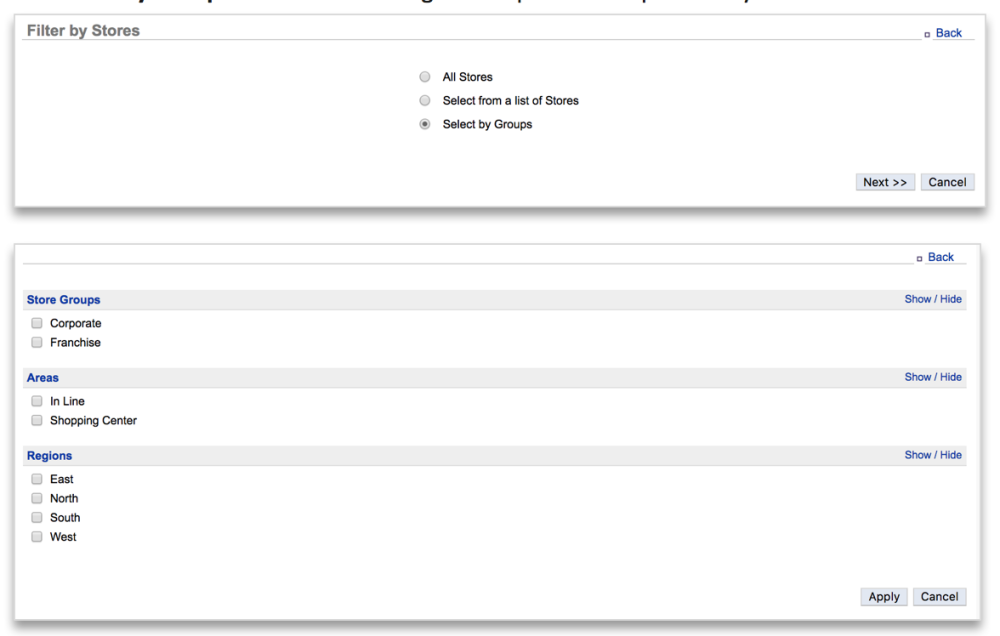
- Click Select by Groups to select sites assigned to specific Groups within your network
![]()
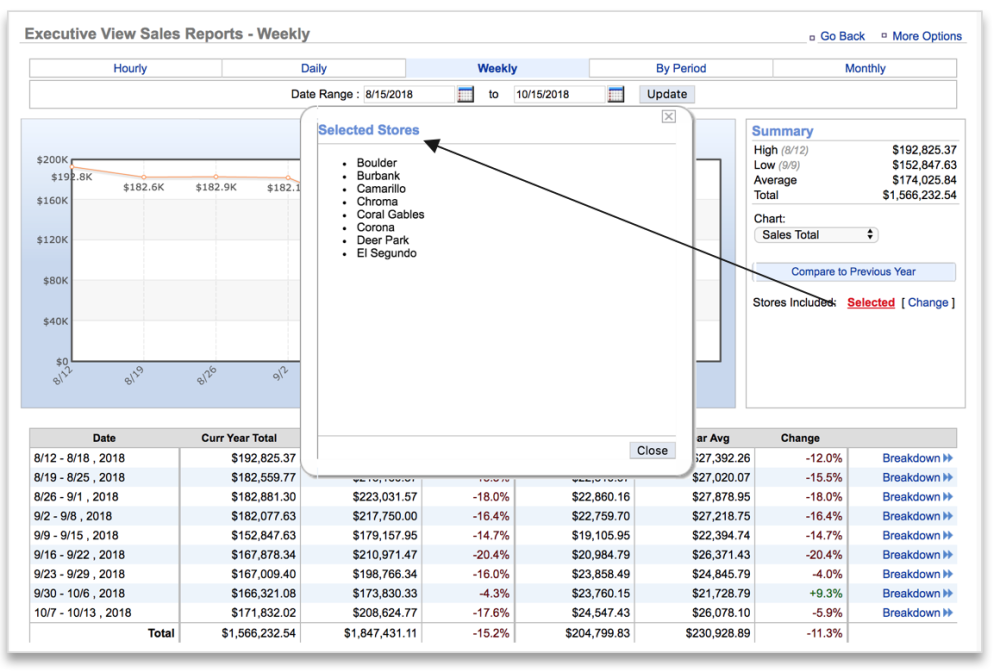
- Once your filtering selections are made, you will be returned to the report screen with filtered results based on those selections
![]()
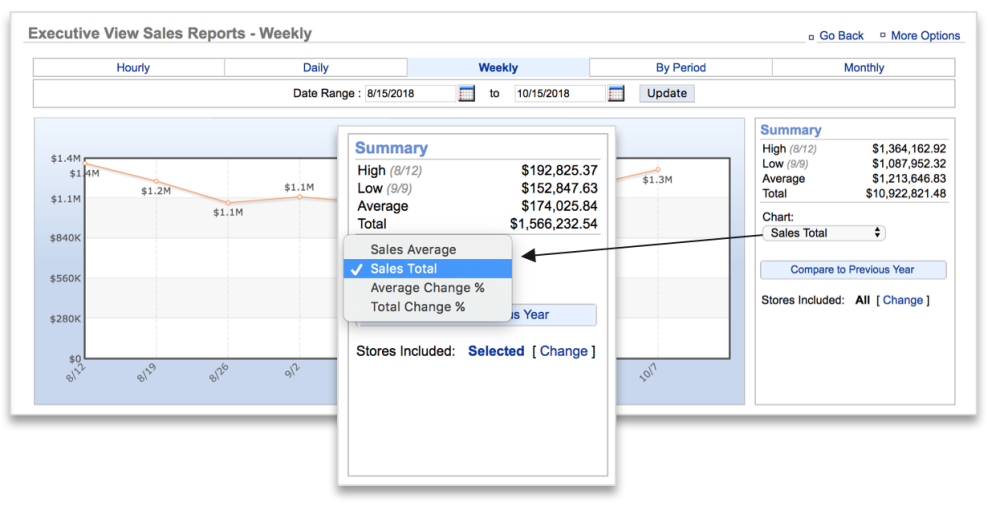
- All Executive View Sales reports include the option to show Sales Average, Sales Total, Average Change % or Total Change % on the chart. Click the dropdown arrows beneath Chart to select a metric to show
![]()

EXECUTIVE VIEW SALES REPORTS
- The Hourly report tab allows you to view the average hourly sales for all, or selected, sites over any given period of time. Report features include the ability to view different metrics on the chart, filter the report by store or group, exclude specific days from the calculations and compare to previous year
![]()
![]()
- The Daily report tab allows you to see the total sales by day for all, or selected, sites over any given period of time. Report features include the ability to view different metrics to the chart, filter the report by store or group, and compare to prior year.
![]()
- The Weekly report tab allows you to see the total sales by week for all, or selected, sites over any given period of time. Report features include the ability to add additional metrics to the chart, filter the report by store or group, and compare to prior year.
![]()
- The By Period report tab allows you to see the total sales by period for all, or selected, sites over any given span of time. Report features include the ability to add additional metrics to the chart, filter the report by store or group, and compare to prior year.
![]()
- The Monthly report tab allows you to see the total sales by day for all, or selected, sites over any given period of time. Report features include the ability to add additional metrics to the chart, filter the report by store or group, and compare to prior year.
![]()