
The purpose of this section is to showcase the Monthly Sales Report category.
Monthly Sales Report
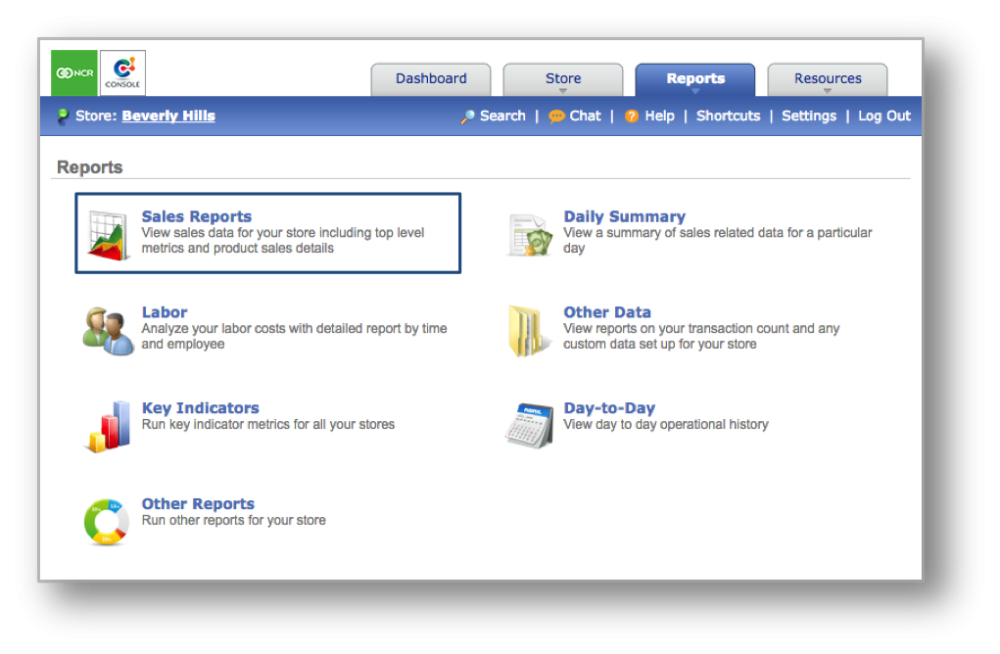
STEP 1: From your Dashboard view, mouse over the Reports tab and click Sales Reports.

*Hint: You can also access the Sales Report by clicking on the Reports tab and then on Sales Reports.
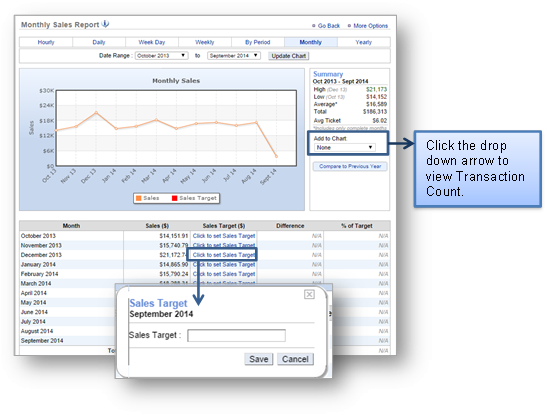
STEP 2: The Monthly Sales Report will automatically appear on screen. To select the monthly report view, mouse over to the Monthly tab at the top of the chart and click it.
The Monthly Report will provide you with sales information for each month within the date range you set. When viewing this report, you will have the option to:
- Select your date range. Enter your preferred date range just above the chart and click Update.
- View by Checks. To the right of your chart, click the drop down arrow beneath Add to Chart and select Checks.
- Set a sales target. Click Click to set Sales Target to the right of any period to enter your target. Click Save when done.
- Export your sales data. Click More Options at the top right corner and then Export Report.
![]()
Related Topics
Daily Sales Report
Week Day Sales Report
Weekly Sales Report
By Period Sales Report
Yearly Sales Report