
For patients:
Once you have logged into the web portal, it opens your Overview page.
To return to this overview, click on the ‘Patient’ icon ![]() in the upper-right corner.
in the upper-right corner.
The navigational menu is located on the left, underneath your name. The following sections discuss each function listed on the navigational menu.
For clinicians:
The detailed patient overview provides a detailed view of your patient.
How to access the Detailed overview
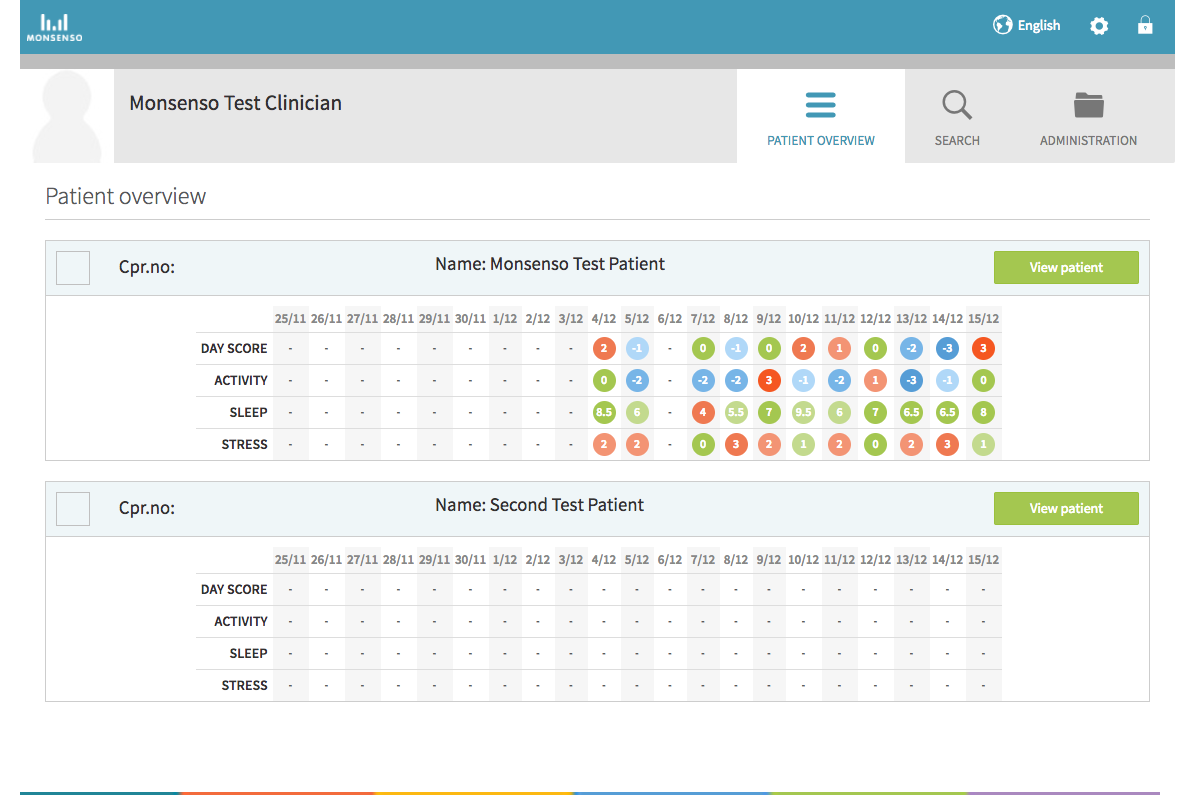
- Go to the Patient Overview
![]() , which is located at the top of the page.
, which is located at the top of the page. - Click on the ‘View patient’ button next to a specific patient’s name to view further information about them.
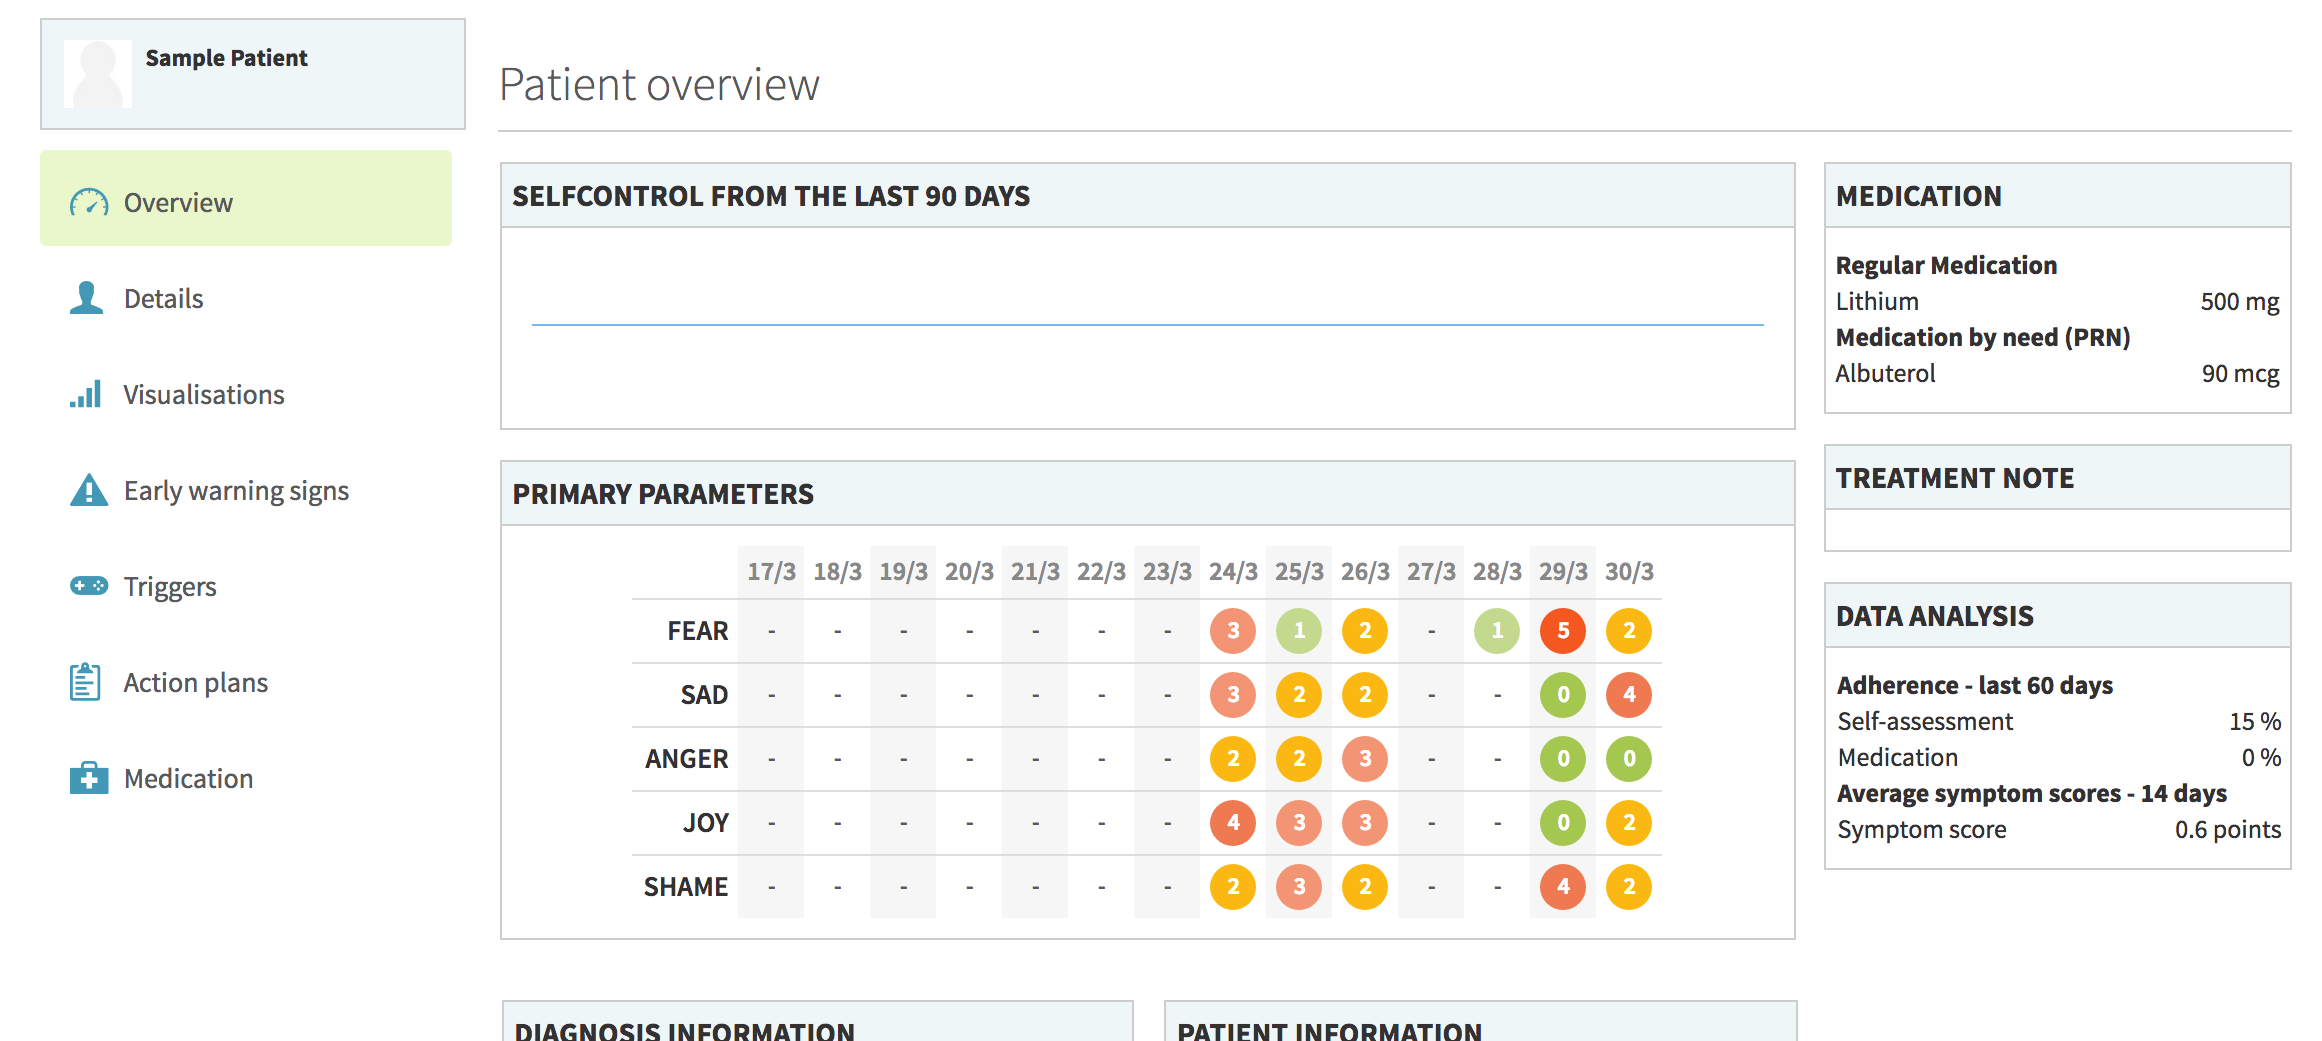
There is a menu on the left side underneath the patient’s name. This menu lists the different sections of the patient’s details that you can view. These include Overview, Details, Visualisations, Warning signs, Triggers, Action plans, Medication, and Journal. Each section will be further explained in the following.
The Overview shows you how the patient scored on select parameters in their self-assessment in the last 14 days. Here, you can also find personal information about your patient, such as diagnosis information, family history and treatment note. The Data analysis widget shows you the patient’s adherence to filling out the self-assessment and taking their medication over the last 60 days, as well as average symptom scores over the last 14 days.

Need more help with this?
Don’t hesitate to contact us here.