
In this module, users can access visual representations of vigilance case and record metrics.
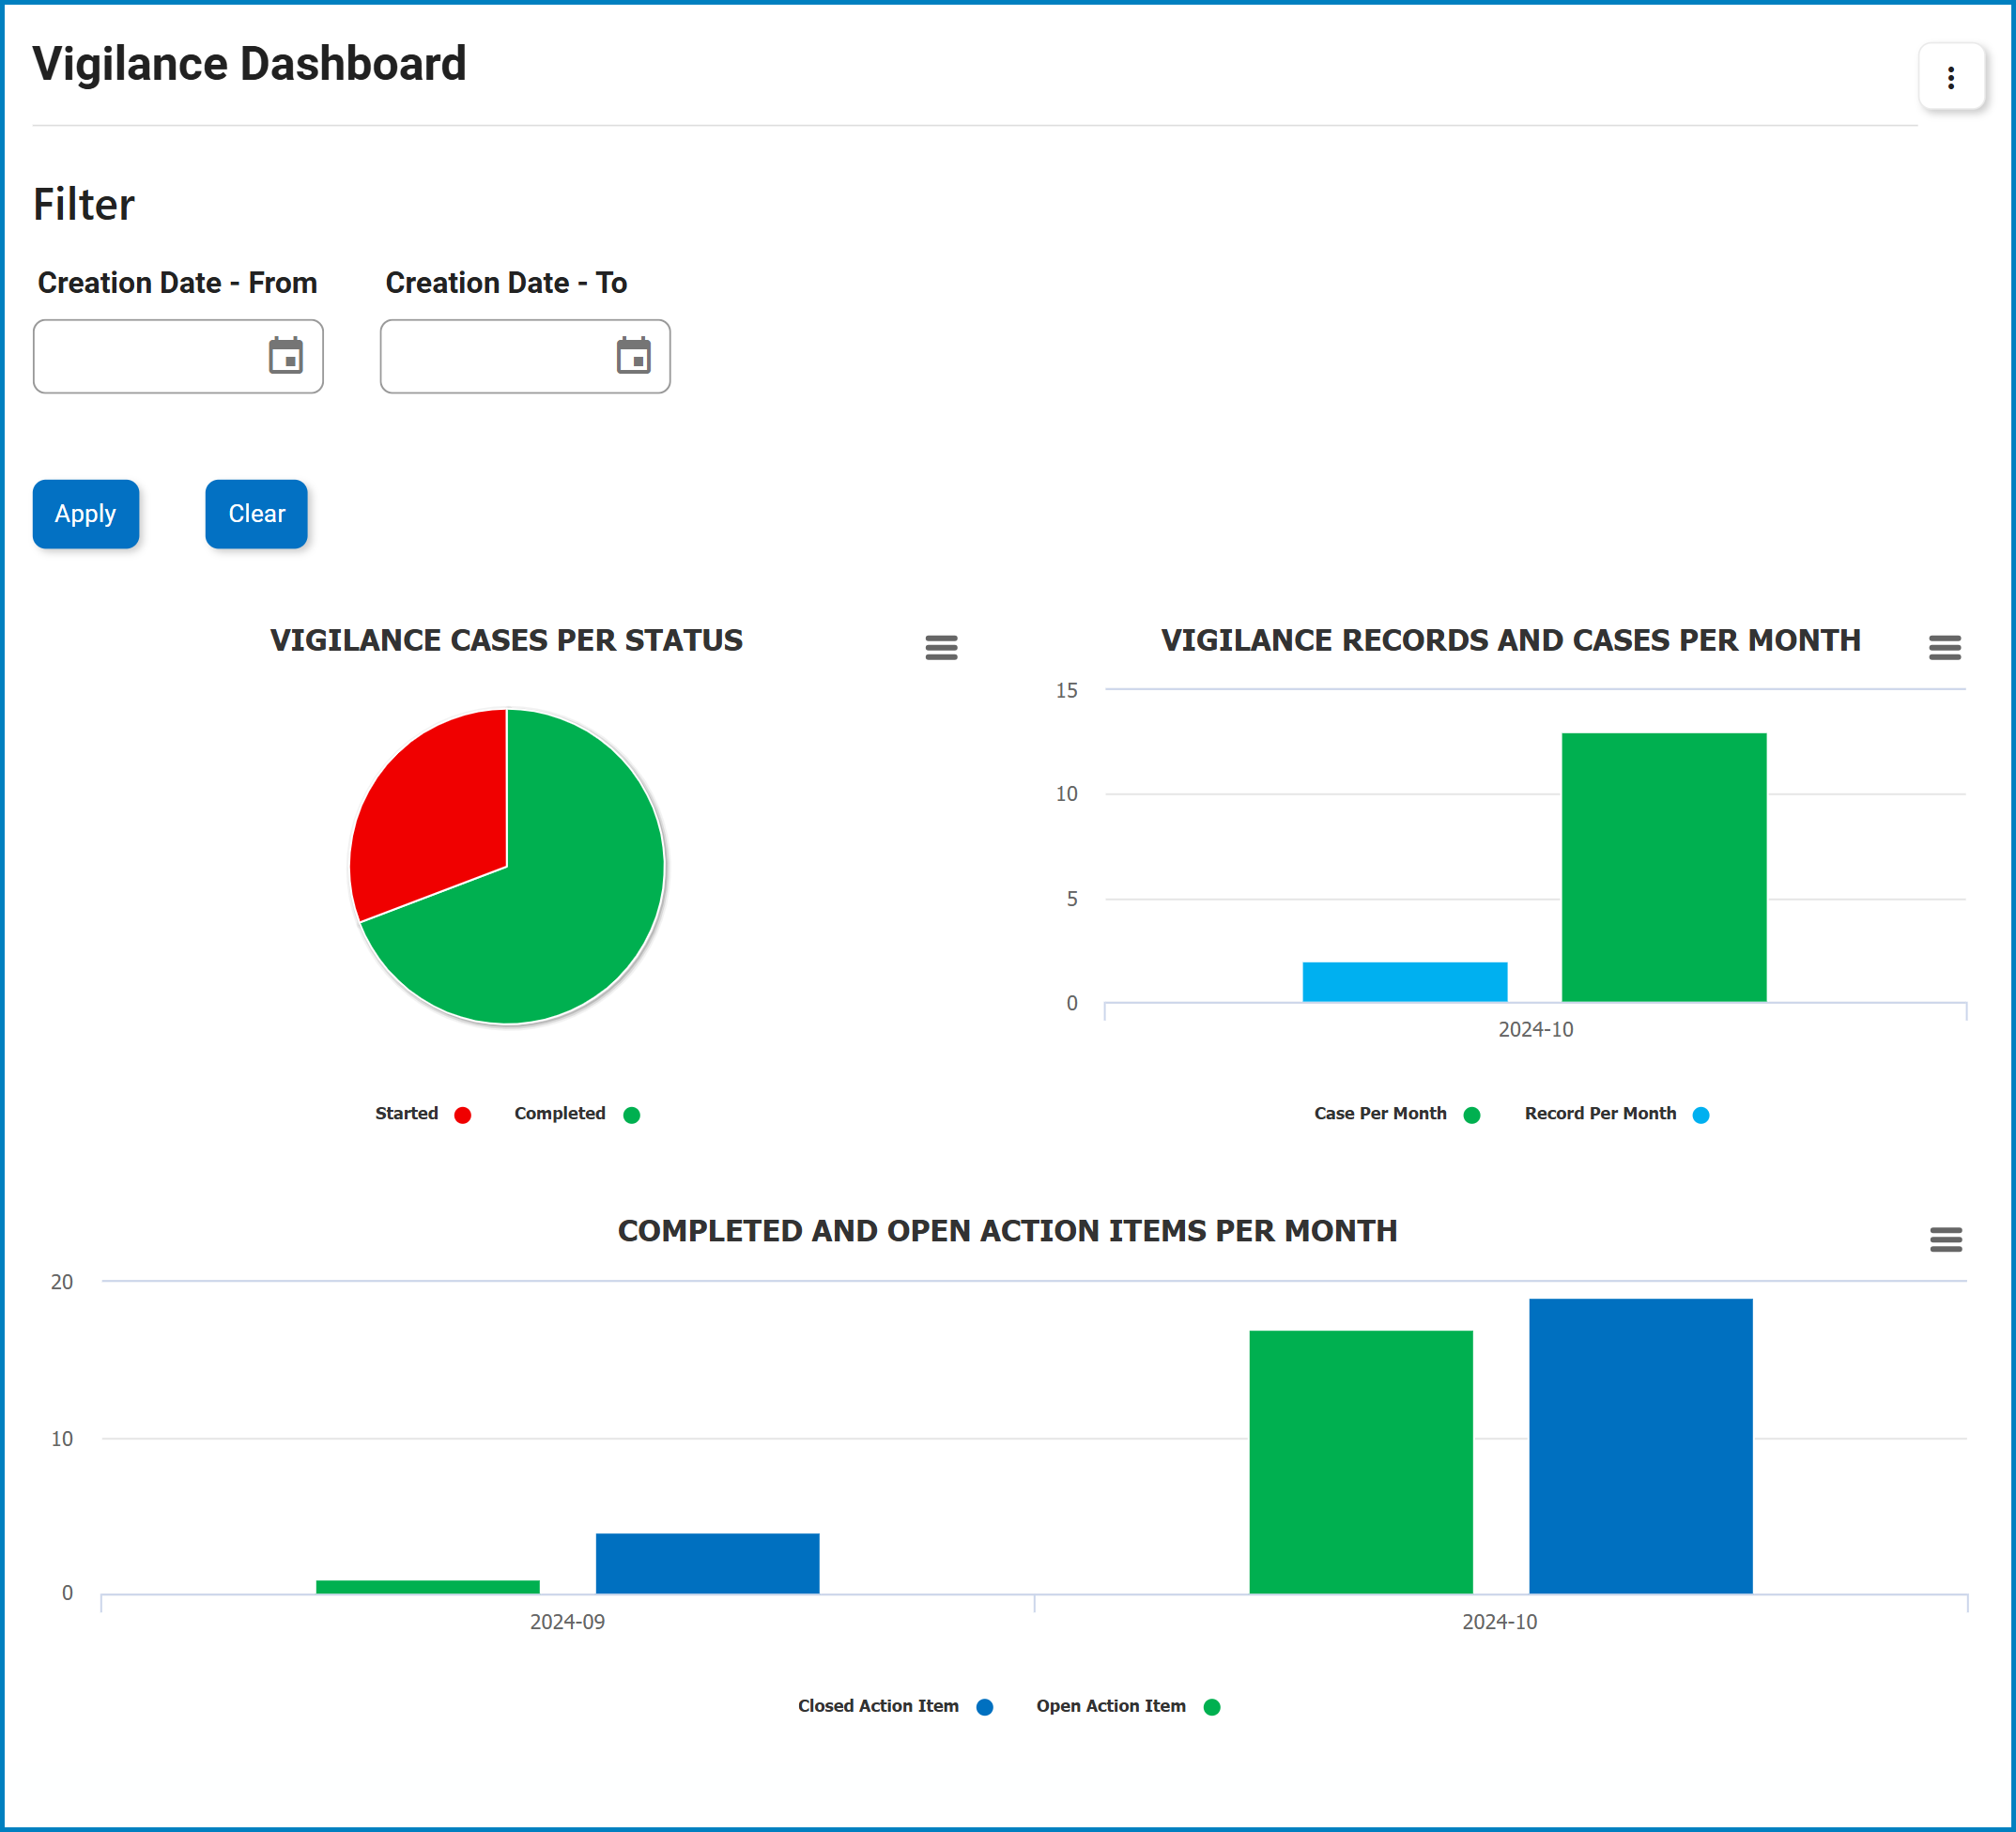
- Filter Panel: Fields within the filter panel function as search boxes. Any value entered will serve as search criteria to filter and retrieve data from the grid as applicable.
- Creation Date – From: This is a date picker that allows users to input/select the start date of the desired range.
- Creation Date – To: This is a date picker that allows users to input/select the end date of the desired range.
- Apply: This button filters the results according to the selected date range.
- Clear: This button clears any applied filters, restoring the display to show the full dataset.
- Chart Context Menus: These hamburger buttons, when clicked, reveal a menu with options for printing or downloading the chart.
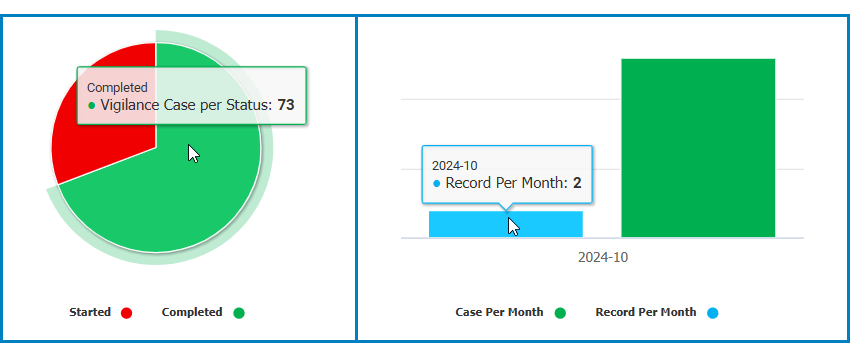
- Data Count: This quantitative data is accessed by hovering your cursor over different data points in the charts (e.g., slices in a pie chart, bars in a bar chart). It represents the number of items in each category.
![]()
- Drilldown Reports: These reports are accessed by double-clicking on specific data points in the charts.
- For example, double-clicking the sector representing completed vigilances cases reveals the following modal window:
![]()
- For example, double-clicking the sector representing completed vigilances cases reveals the following modal window:

Post your comment on this topic.