
The purpose of this section is to illustrate how to generate, and view a Product Mix Report.
Product Mix Report
STEP 1: From your Dashboard view, mouse over the Reports tab and click Sales Reports.
*Hint: You can also access Sales Reports by clicking on the Reports tab and then on Sales Reports.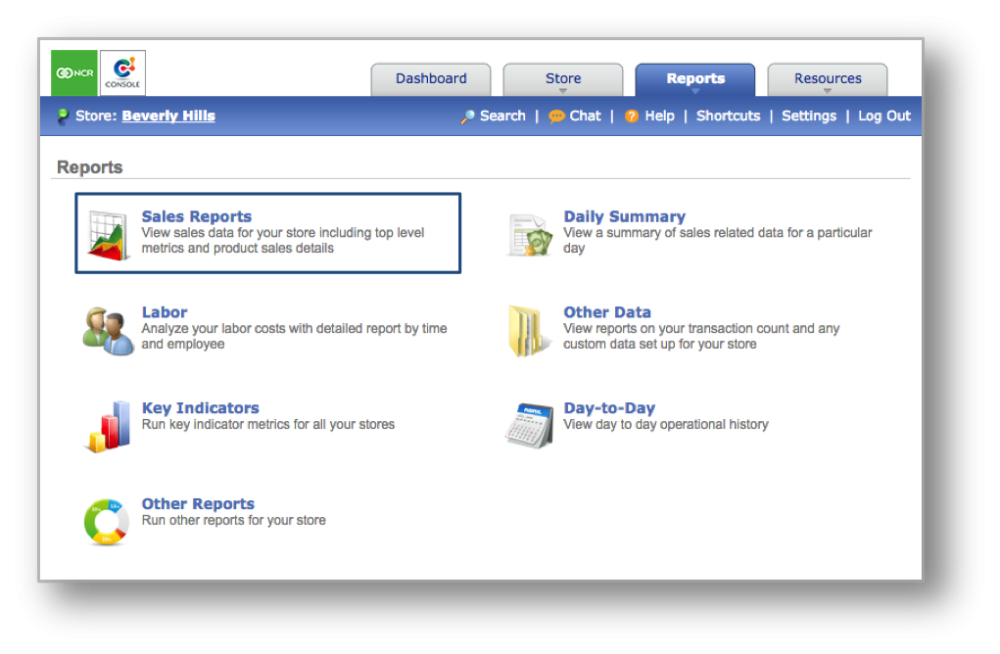
STEP 2: From the Sales Reports screen, click Product Mix.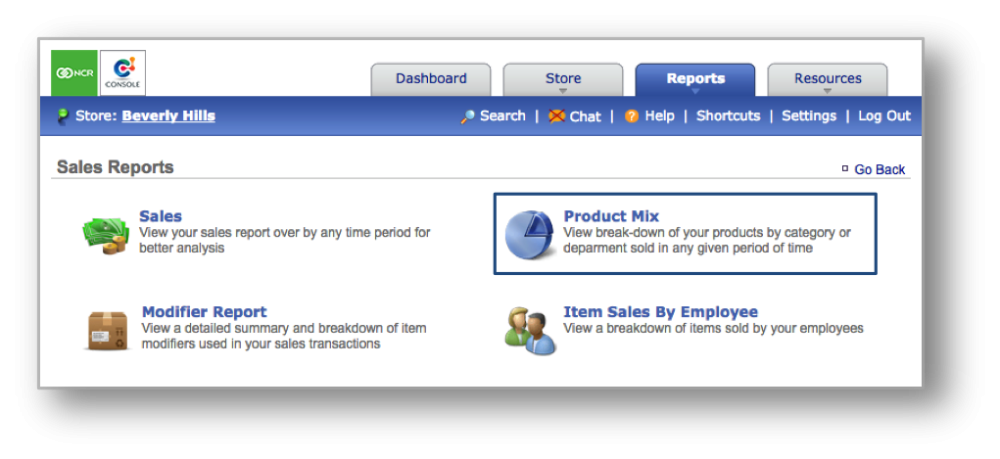
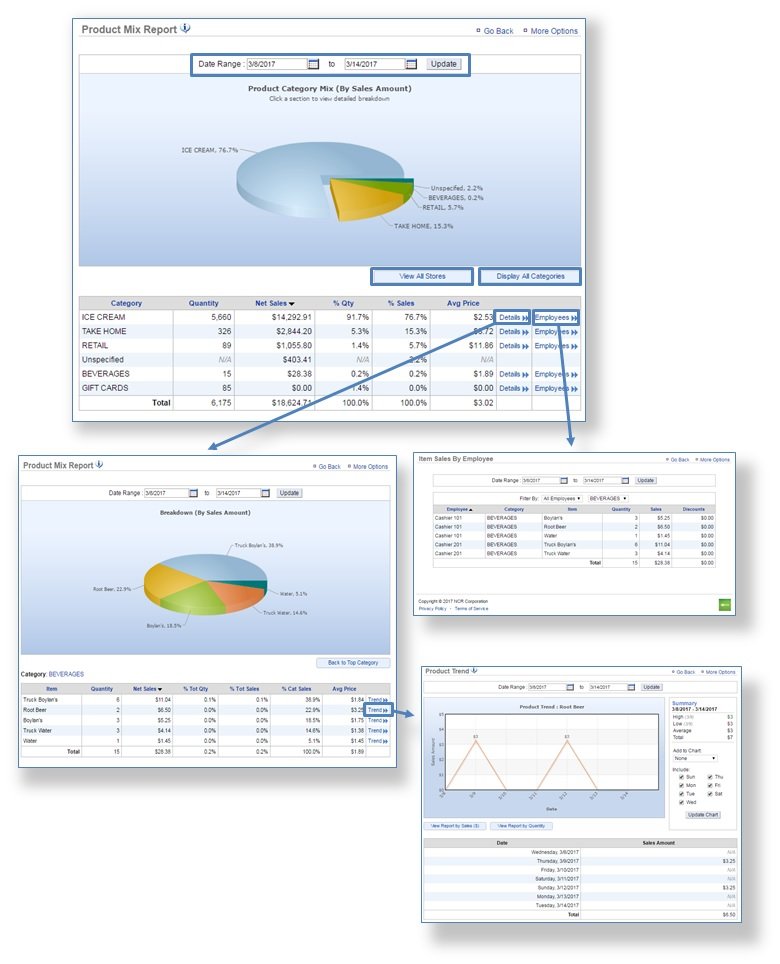
STEP 3: The Product Mix Report will provide you with sales information related to product for the date range you set. To select a date range, enter your preferred date range at the top of the page and click Update.
- Click Details at the bottom right of the chart details section to view sales information for items within a specified category. Within this view, click Trend to the right of any category item to see the purchasing trend for the date range you set. See STEP 3 for more detailed information.
- Click Employees, to view your item sales for that category by your employees.
![]()
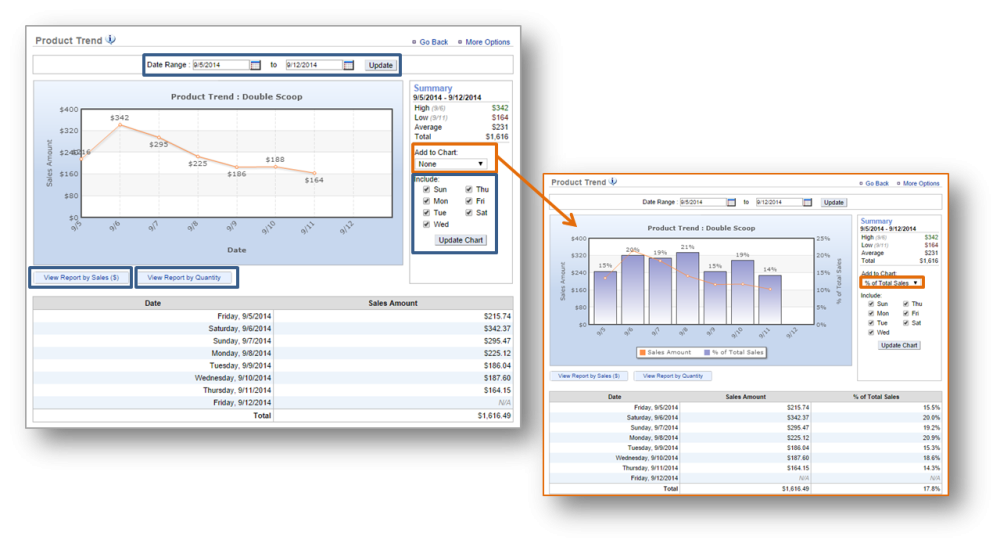
STEP 4: When viewing trends, you will have the option to view by week day(s). To do so, deselect those days (to the right of the chart) you wish to remove and click Update Chart.
- To add the percentage of total sales to your chart, click the drop down arrow below Add to Chart and select % of Total Sales.
- To compare to previous year trends, click the drop down arrow below Add to Chart and select Previous Year.
- Toggle between View Report by Sales ($) and View Report by Quantity based on how you would like to see the data.
![]()
STEP 5: To view a more comprehensive product mix report, you have the option to click View All Stores or Display All Categories depending on what data you are trying to see.
- Click View All Stores at the bottom right of the chart to view product mix data by category for all stores within your network.
- Click Display All Categories at the bottom right of the chart to view a detailed numeric breakdown of items within each category.
![]()

Related Topics
Sales Reports
Labor Reports