
On a wall, you can integrate:
- Charts (from Explore)
- News feeds (from your searches, collections, etc.)
- Documents (PDF, Excel, etc.)
- Your newsletters
- External Widgets (iFrame) to Cikisi (a FRED graphic on the example above)
- Of text
- Images
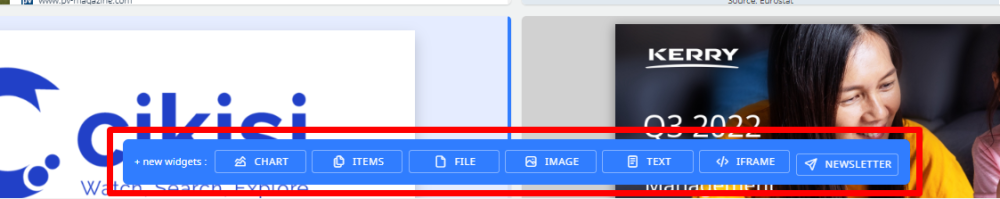
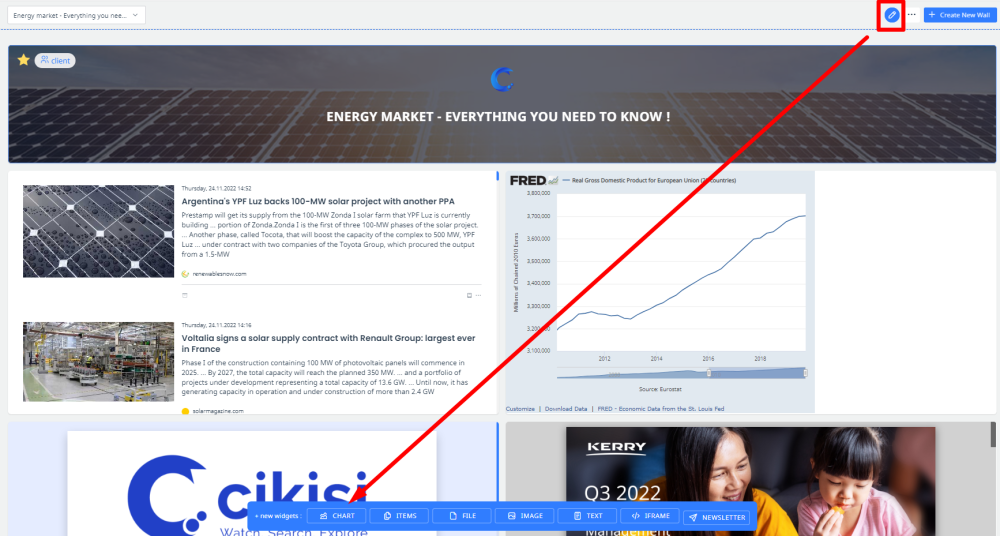
After clicking on the pencil in the upper right corner of the wall (editing mode), this sub-menu will appear at the bottom of the screen:
These content widgets are quite easy to insert.
Choose the type of module to insert and drag it to the place of your choice and release the click
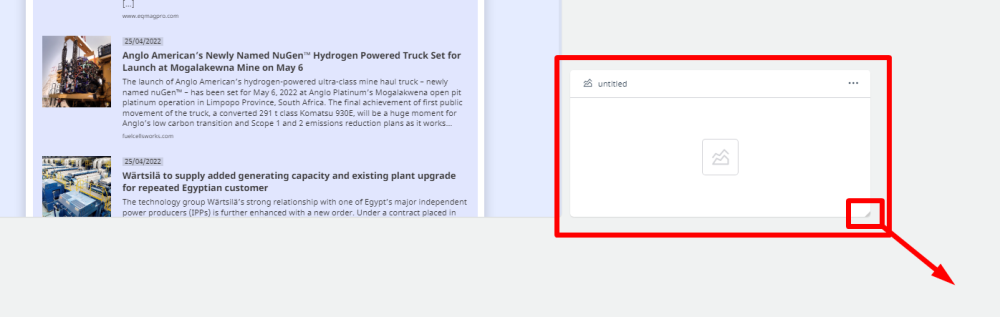
You can then move it by holding down the click, give it a name (“untitled”) or complete it (click on the square in the middle of the box).
Then simply follow the creation form, very short and well explained.
We will limit this tutorial to creating with you graphics & charts, an iFrame and a newsletter.
Add a chart
Click on the “Chart” widget, hold the click and drag it to the location of your choice.
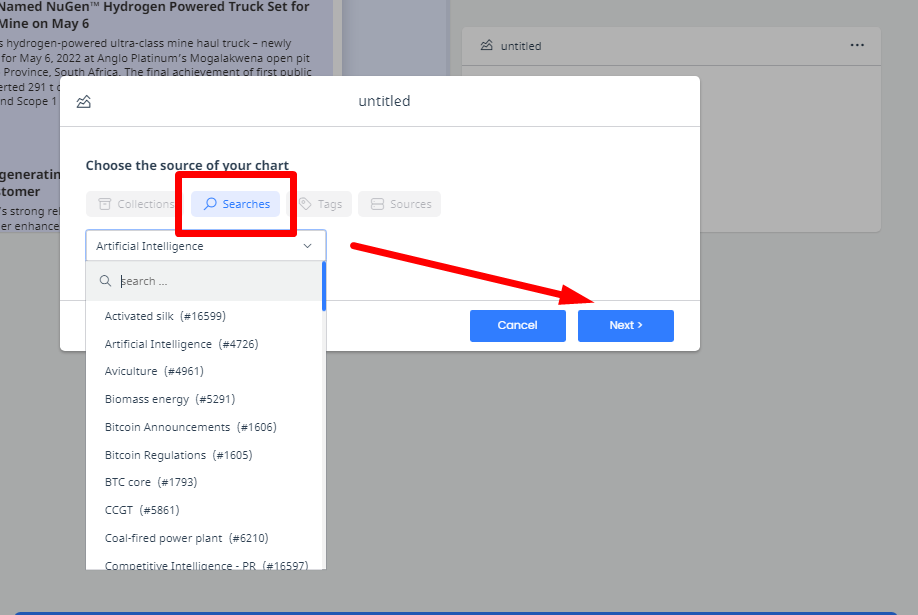
Then click on the middle square. The form for creating this “chart” widget will open.
- First select the origin of the articles that will be used to feed your graph (a collection, a search, articles grouped by a tag or items from a source) and click on NEXT.
- On the next page, choose the type of data on which you want to build a graph (dates of publications, AI entities, geographic coordinates, etc.)
Then choose from the available chart types (linear, bar, pie, etc.) and press NEXT. - Define over which period the graph will load your article data (ex. the last 7 days). NEXT.
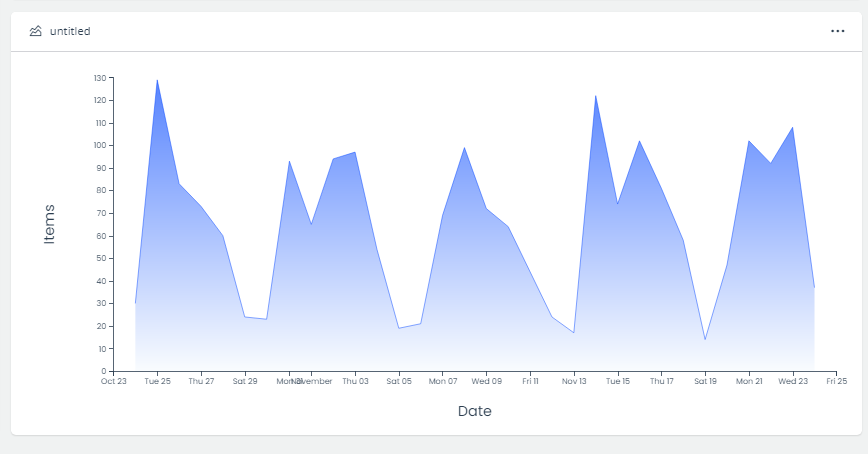
- Here is a recap. Everything seems in order? So, click “submit”.
Here is the result:
iFrame
For the iFrame widget, you can either insert (copy-paste) a URL of an accessible web page, or the code of an external iFrame.
The “URL” option will allow you to preview a webpage.
You will find iFrames on financial sites, for example, to follow in graphic form the evolution of cryptocurrency values for example.
The FED site of Saint-Louis economic research offers good examples of Widgets:
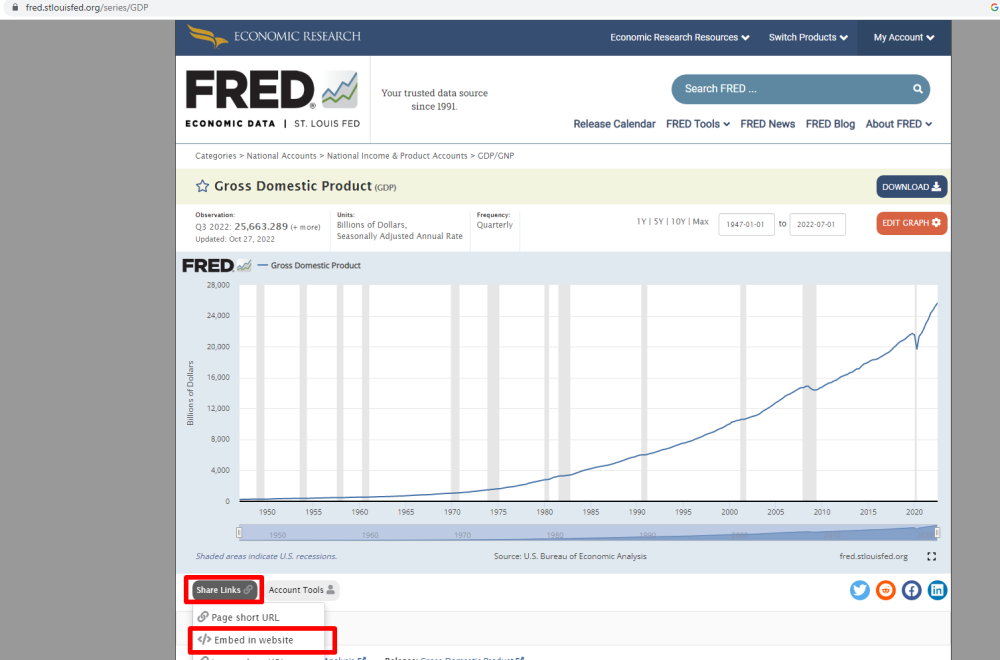
Here is the iFrame code to paste in the Cikisi widget:
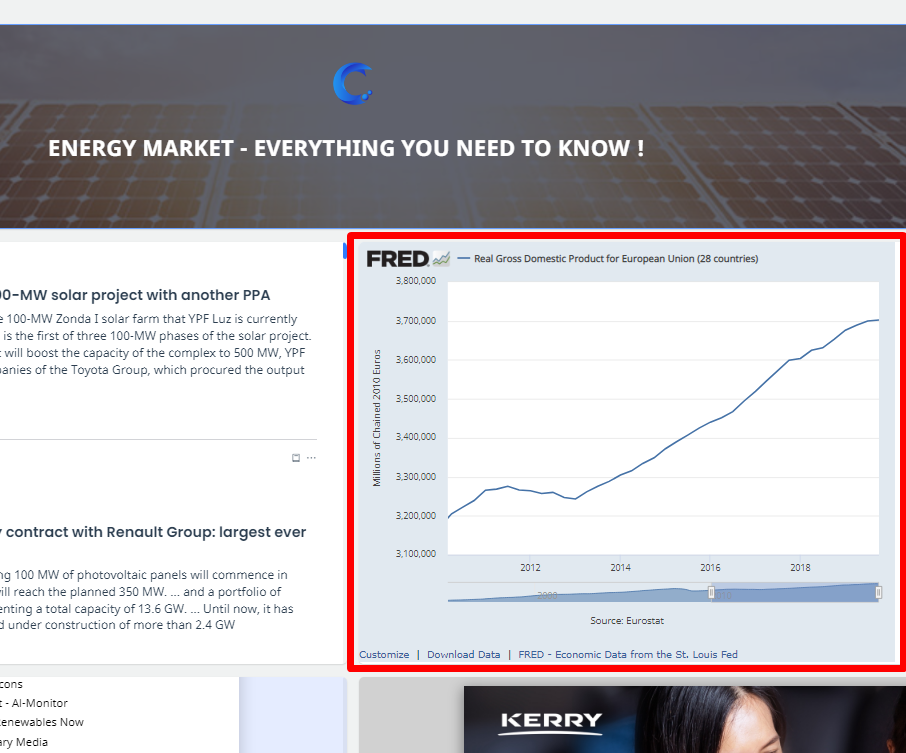
< iframe src=“https://fred.stlouisfed.org/graph/graph-landing.php?g=Wa1T&width=670&height=475” scrolling=“no” frameborder=“0” style=“overflow:hidden; width: 670px; height:525px;” allowTransparency=“true” loading=“lazy”>
Here’s the result:
The newsletter
The newsletter is easy to insert. Just select it from a list. However, you must put it online before you can display it on your wall.
To put a newsletter “online”:
- Go to the “Newsletter” menu on the left vertical menu (features)
- Open your newsletter
- At the top right, check the “Visit link” option
- Then select the edition to display “online”
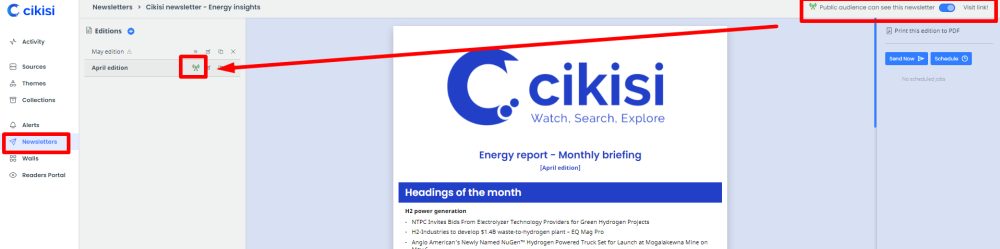
Then go back to your wall to complete the “Newsletter” form.
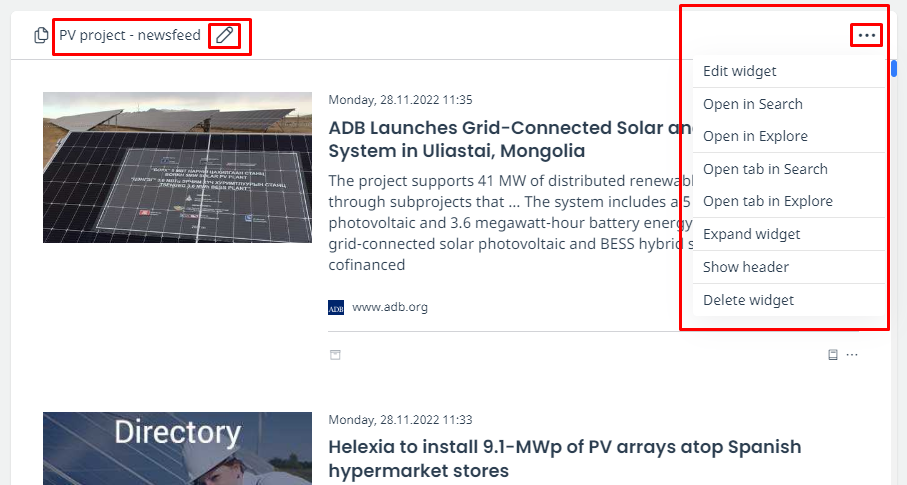
Other Options
Finally, if you click on the three small dots at the top right of your widget, you will be able to:
- remove widget
- expand it to full screen
- open its research, collection, etc. original
- Show or hide its title
You can also click on its title to name the widget.
Post your comment on this topic.