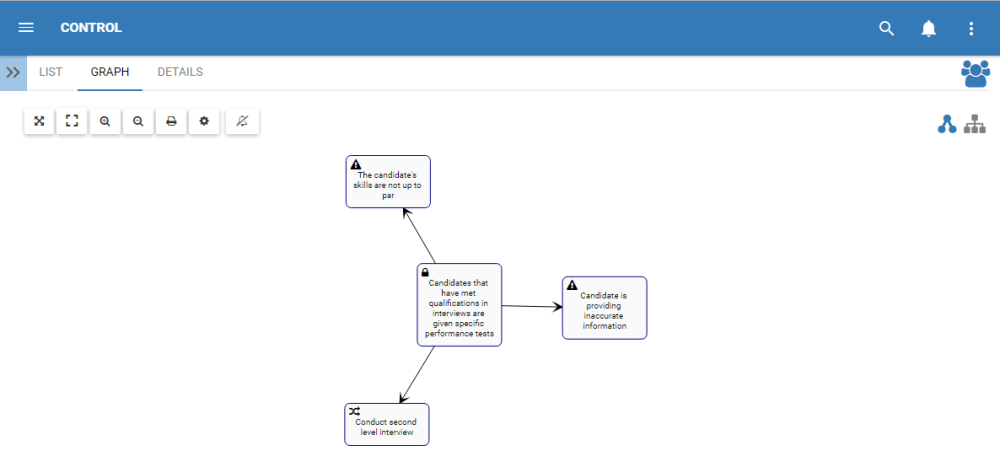
The Options button has been added to allow users to customize the Graphs they view. Customization allows users to select exactly what is displayed in each graph, allowing them to prioritize key information in a format of their choice.
This section will cover navigation to the options button.
To use the Options button, please see the following instructions
1. Select the Options button at the upper left corner of the page

2. The Options panel will be displayed on the screen as shown

To customize the graph and use the Filter option, please see the steps below:
1. Select “Options” icon 
2. Navigate cursor to “Asset, Attribute”

3. The following drop-down menu will be generated

4. Select the desired filter and select “Save Changes.” For this example, we will select Risk and Task

6. The following graph will be generating showing only the Risks and Tasks that are related to the specific Control

Haben Sie noch weitere Fragen?
Visit the Support Portal


