
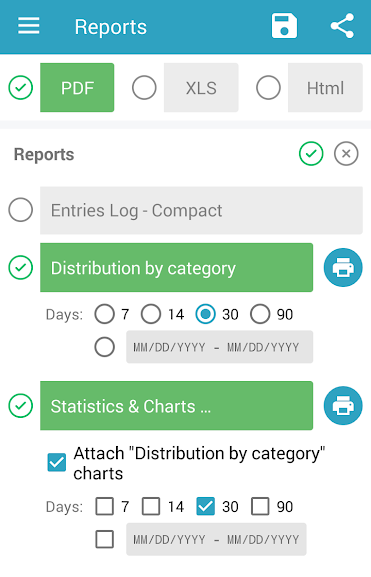
Using the Reports screen users can generate various reports which the specialists can review.
Report types
Ambulatory Glucose Profile (AGP)
Ambulatory Glucose Profile (AGP) is a single page report for interpreting a patient’s daily glucose and insulin patterns. AGP provides both graphic and quantitative characterizations of daily glucose patterns.
Pattern Analysis
This is an advanced pattern analysis of the logbook data. The Diabetes:M server tries to find various patterns in the last 14 days and how often they happen in your daily routines. The system lists all occurrences and the possible reasons which might cause the particular pattern to appear. Although it shows all patterns, the really important ones are those with more than 2 or 3 occurrences.
LogBook
The LogBook report contains a table including all logged entries for the given period of time. The table includes entry number, date/time, glucose level (colored for low/high/normal), carbohydrates taken, insulin doses (including basal and extended boluses), other medications, category (after/before dinner/breakfast etc.), notes, additional info. The report is good to show your treatment and intakes in details.
LogBook (Compact)
Report which includes glucose, carbohydrates, bolus and basal in a table separated by every hour of every day in the reporting period.
CategoryDistribution
Report which includes glucose, bolus and carbohydrates, grouped by category (breakfast, after breakfast, lunch, after lunch, etc.) for every day from the reporting period
Detailed Report
Detailed report which includes graphs and charts from those seen in the application (Graphs and Charts). Most of the charts can be configured to show different periods of time, including copies of the charts with more than one time period. In this report you can include almost all charts:
- “Distribution by category” charts – places the distribution by category pie charts in the attached main report for the last 7, 14, 30, 90 days or for a custom time period.
- “Glucose overlay” chart – places the glucose overlay charts in the attached main report for the last 7, 14, 30, 90 days or for a custom time period.
- “Metabolic control” chart – places the metabolic control chart in the attached report for the last 7, 14, 30, 90 days or for a custom time period.
- “Category averages” chart – places the meal time averages charts in the attached main report for the last 7, 14, 30, 90 days or for a custom time period.
- “Insulin daily totals” chart – places the totals for insulin intake chart in the attached main report for the last 7, 14, 30, 90 days or for a custom time period.
- “Carbs/Insulin averages” chart – places the averages for insulin and carbohydrates intake charts in the attached main report for the last 7, 14, 30, 90 days or for a custom time period.
- “Carbs/Calories totals” chart – places the totals for carbohydrates and calories intake charts in the attached main report for the last 7, 14, 30, 90 days or for a custom time period.
- “Glucose history” chart – places the glucose history charts in the attached main report for the last 7, 14, 30, 90 days or for a custom time period.
- “Weight history” chart – places the weight history chart in the attached main report for the last 7, 14, 30, 90 days or for a custom time period.
- “Blood Pressure and Pulse history” chart – places the blood pressure and pulse history chart in the attached main report for the last 7, 14, 30, 90 days or for a custom time period.
- “HbA1c history” chart – places the blood pressure and pulse history chart in the attached main report for the last 2 years.
- “Cholesterol history” chart – places the cholesterol history chart in the attached main report for the last 2 years.
- “Injection sites information” graphic – places the injection sites information graphic in the attached main report for the last 2 years.
- Patterns report – report including all the data from our patterns feature including all the patterns found within the last 14 days and the entries matched in the patterns
The reports can be generated in different formats – XLS, PDF, HTML and can be printed, shared in some apps (google drive, email clients and others similar) or sent via email.
Sample reports:
- Distribution by category report
Sample Distribution by category report - Logbook report
Sample Logbook report - Compact Logbook report
Sample compact logbook report - Detailed report with charts and statistics
Sample detailed report - Patterns analysis report
Sample patterns analysis report
Need more help with this?
Don’t hesitate to contact us here.