
Blood glucose index (BGI) values are risk indicators for hypoglycaemia and hyperglycaemia probability.
For BGI calculation, please refer to Risk Analysis of Blood Glucose Data: A Quantitative Approach to Optimizing the Control of Insulin Dependent Diabetes by Boris P. Kovatchev, Martin Straume, Daniel J. Cox, and Leon S. Farhy
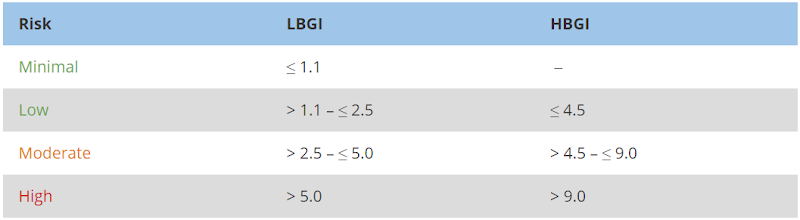
Usually, the farther the Blood Glucose Index is from the safe area, the higher is the risk potential for low or high glycaemic levels.
- Low blood glucose index (LBGI) indicates the probability for hypoglycaemia
- High blood glucose index (HBGI) indicates the probability for hyperglycaemia
Blood Glucose Variability is important measure because it provides additional clarification for HbA1c value. HbA1c shows the blood glucose average for the last 3-4 months but the good HbA1c could be a result of very high and very low blood sugar levels which large variability must be avoided by all means. For variability index in Diabetes:M is chosen the average daily Blood Glucose Standard Deviation (BGSD) for the selected time interval.
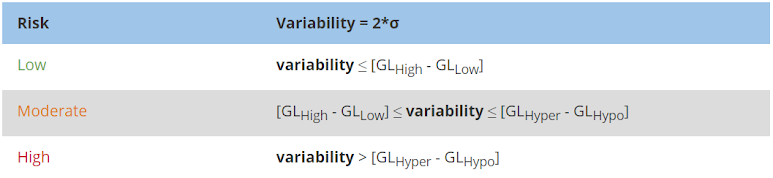
The variability risk estimation is as follows:
σ = Blood Glucose Standard Deviation of glucose readings x1, x2, …, xN where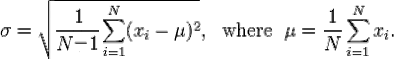
GLHypo ‒ Hypoglycaemia Limit
GLLow ‒ Glucose Low Limit
GLHigh ‒ Glucose High Limit
GLHyper ‒ Hyperglycaemia Limit
Need more help with this?
Don’t hesitate to contact us here.