
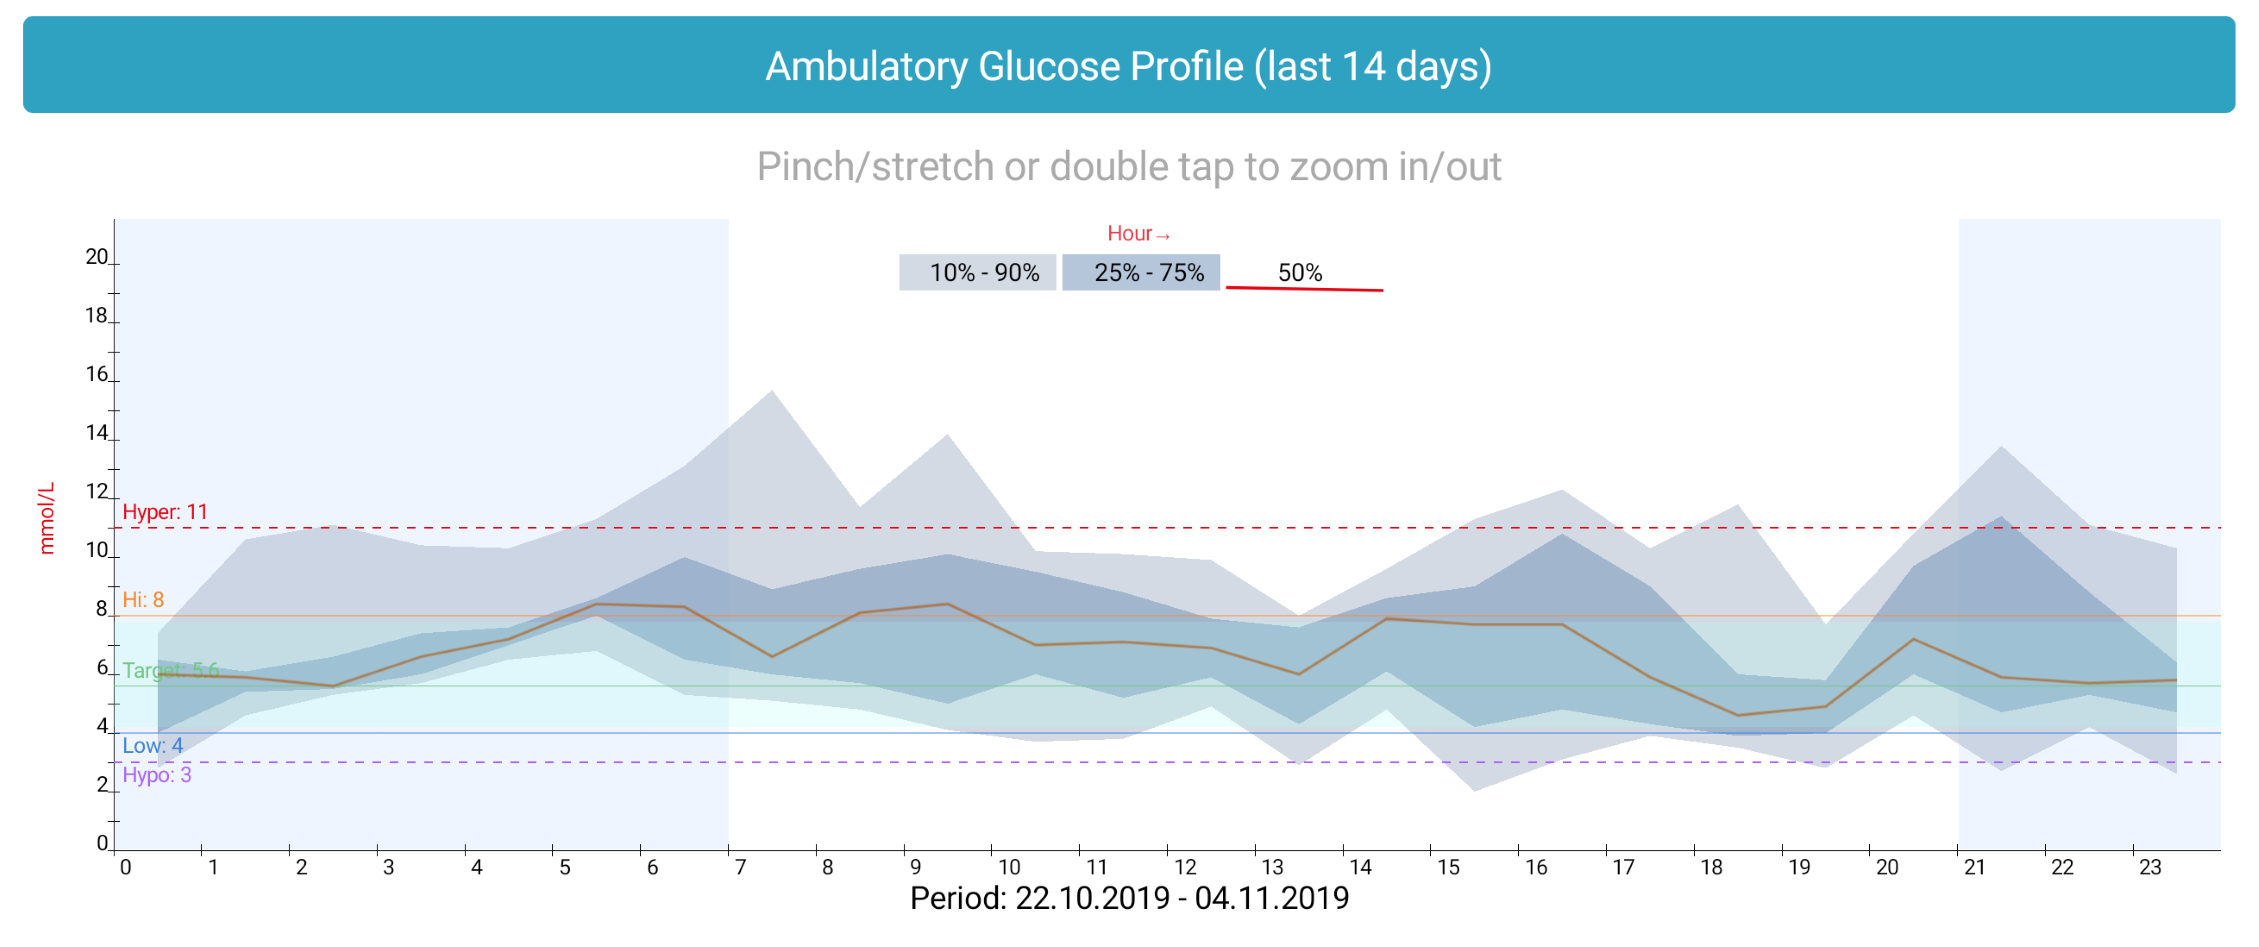
Ambulatory Glucose Profile (AGP)
Ambulatory Glucose Profile (AGP) is a chart for interpreting a patient’s daily glucose and insulin patterns. AGP chart provides graphic characterizations of daily glucose patterns. It shows the 10%-90% and 25%-75% percentiles zones and 50% median line of all the glucose readings for the selected interval during 24 hours. This helps to see for which hours you glucose varies the most.
More information about how to interpret the chart can be found in the article "AGP Core Curriculum – AGP Clinical Academy" by Prof. Roger Mazze and Dr. Iain Cranston at https://static1.squarespace.com/static/5a4cf19e51a5840a334adcfd/t/5a8b45ae71c10b58453cf148/1519076808390/AGP+Core+Curriculum+02-2018.pdf
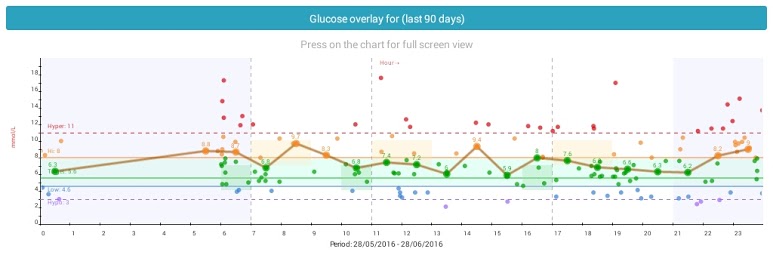
Glucose Overlay
This chart shows the distribution of all the glucose readings for the selected interval during 24 hours. This helps to see for which hours you don’t have enough information. Usually all the readings are clustered around the meal hours but it is good to know what are the values for our blood glucose during the whole day. You can also find some patterns in some hours of low/high glucose levels through the day.
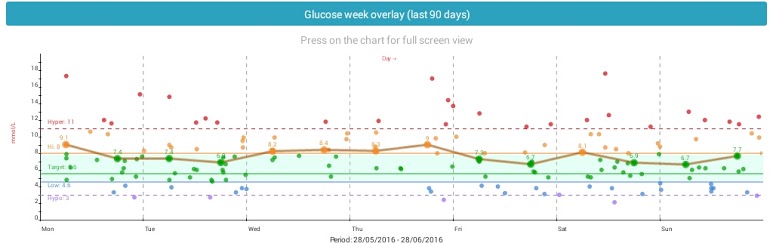
Glucose Week Overlay
This chart shows the distribution of all the glucose readings for the selected interval during the week. It can help you find strange glucose level readings by day, for example you may find out some day of the week you have lower/higher glucose levels and you can than think about why this happens and find some actions or events in that day that affect your glucose levels.
For every day the averages are calculated for the first and the second half of the day. For every day there are two averages from 12:00 am to 12:00 pm and from 12:00 pm to 12:00 am.
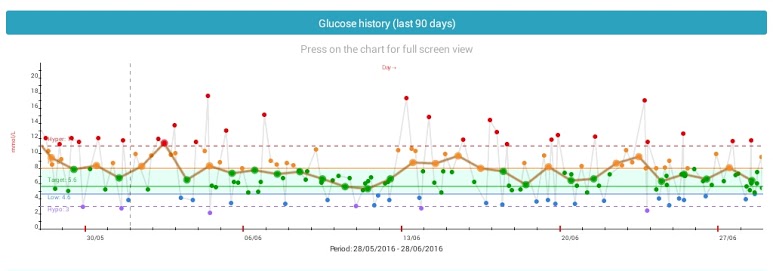
Glucose History
This chart shows the history of all the glucose readings for the selected interval. Averages are calculated per day. You can find out how some events affected your diabetes management, for example if you were on a vacation for a few days, you can see those days averages here.
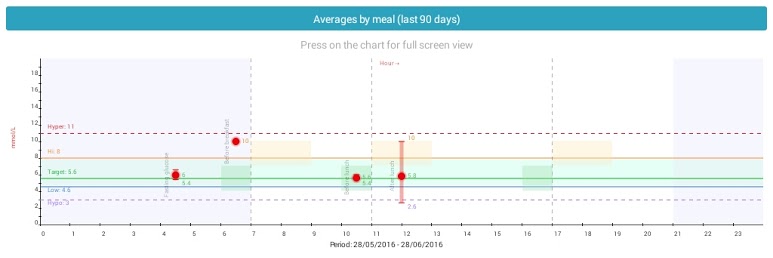
Averages by meal
This chart shows the minimum, maximum and average values of blood glucose per meal categories. The chart can help you find if you have too big deviations of the blood glucose during the day. Usually you may have good average glucose values, but if you have big deviations it’s not a good sign for your diabetes management.
Need more help with this?
Don’t hesitate to contact us here.