
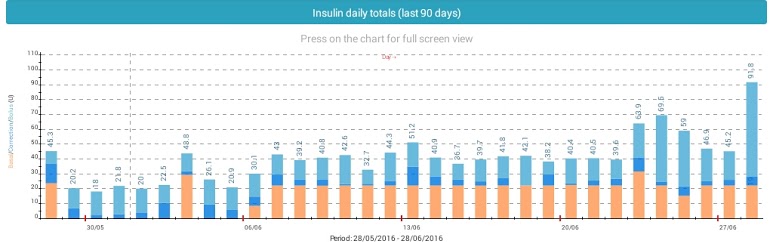
Insulin daily totals
This chart shows the insulin daily totals for the selected interval. Bars show the ratio between basal (orange), bolus (light blue) and correction bolus (dark blue) insulin totals.
It can help you find out if your insulin injections are similar through the day or if you have too many corrections, which may be a bad sign.
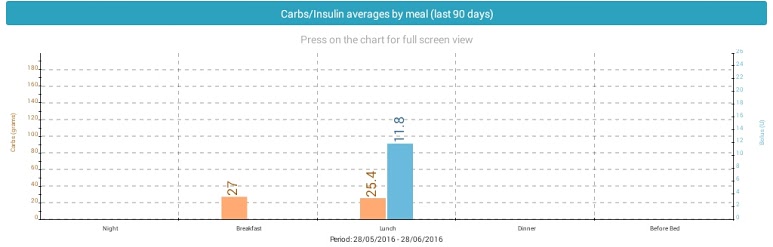
Carbohydrates and insulin averages by meal
This chart shows the average insulin and carbohydrates by periods of the day – night, breakfast, lunch, dinner, before bed.
It can help you to see your average carbohydrates intake and your average insulin intakes by time of the day. This way you can find how different carbohydrates amounts affect your insulin intakes and the opposite.
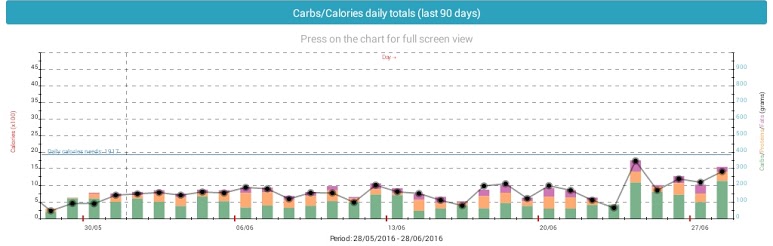
Food nutrition data and grams intake
This chart shows carbohydrates (green), proteins (orange) and fats (purple) of the food you take over the selected period of time, distributed by times of the day. Also it shows calories count (the black line with dots), needed calories and food’s weight.
Need more help with this?
Don’t hesitate to contact us here.