
In the CAPA Dashboard module (located in the QMS Dashboard application), users can access visual representations of CAPA statistics.
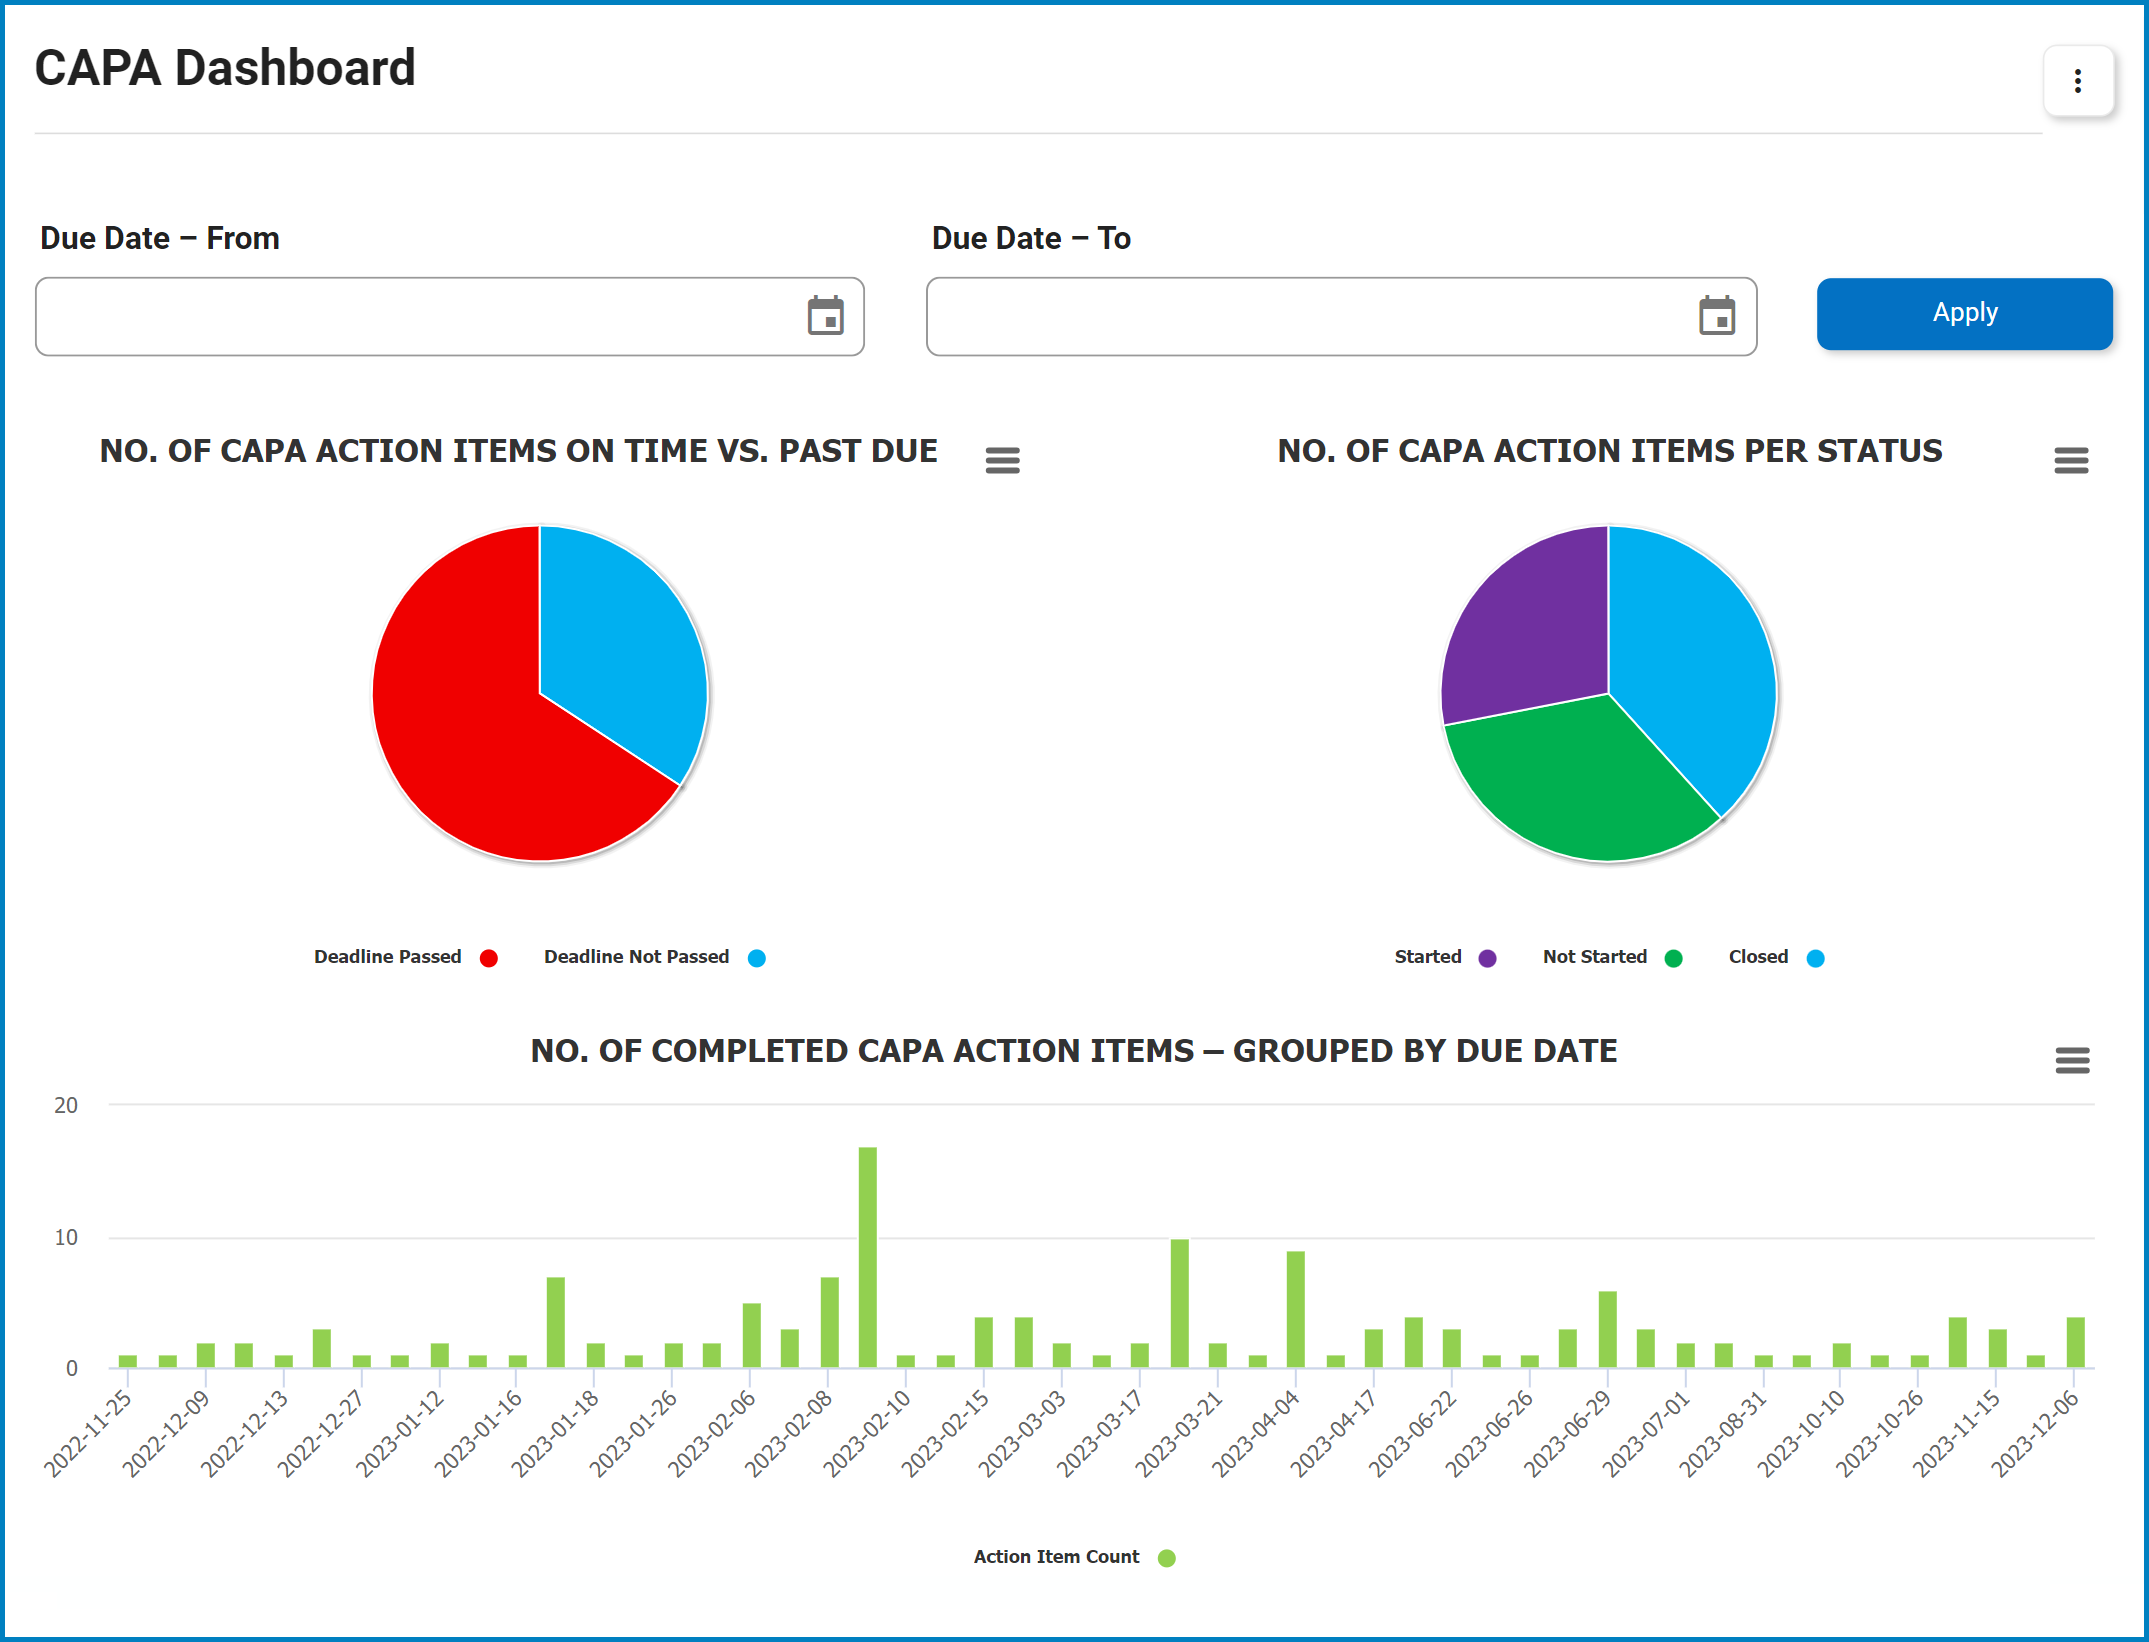
- Due Date – From: This is a date picker that allows users to input/select the starting date.
- Due Date – To: This is a date picker that allows users to input/select the ending date.
- Apply: This button filters the results according to the selected date range.
- Chart Context Menus: These are hamburger buttons which, when collapsed, display a list of options that allow users to either print or download the chart.
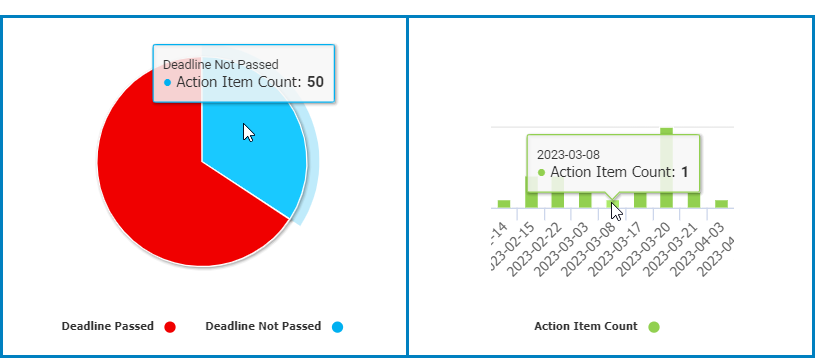
- Action Item Count: This is quantitative data that users can access by hovering their cursor over the different symbols in the charts. (Symbols, in this case, refers to the slices of the pie charts and the bars of the bar chart). It represents the number of action items per category.
![]()
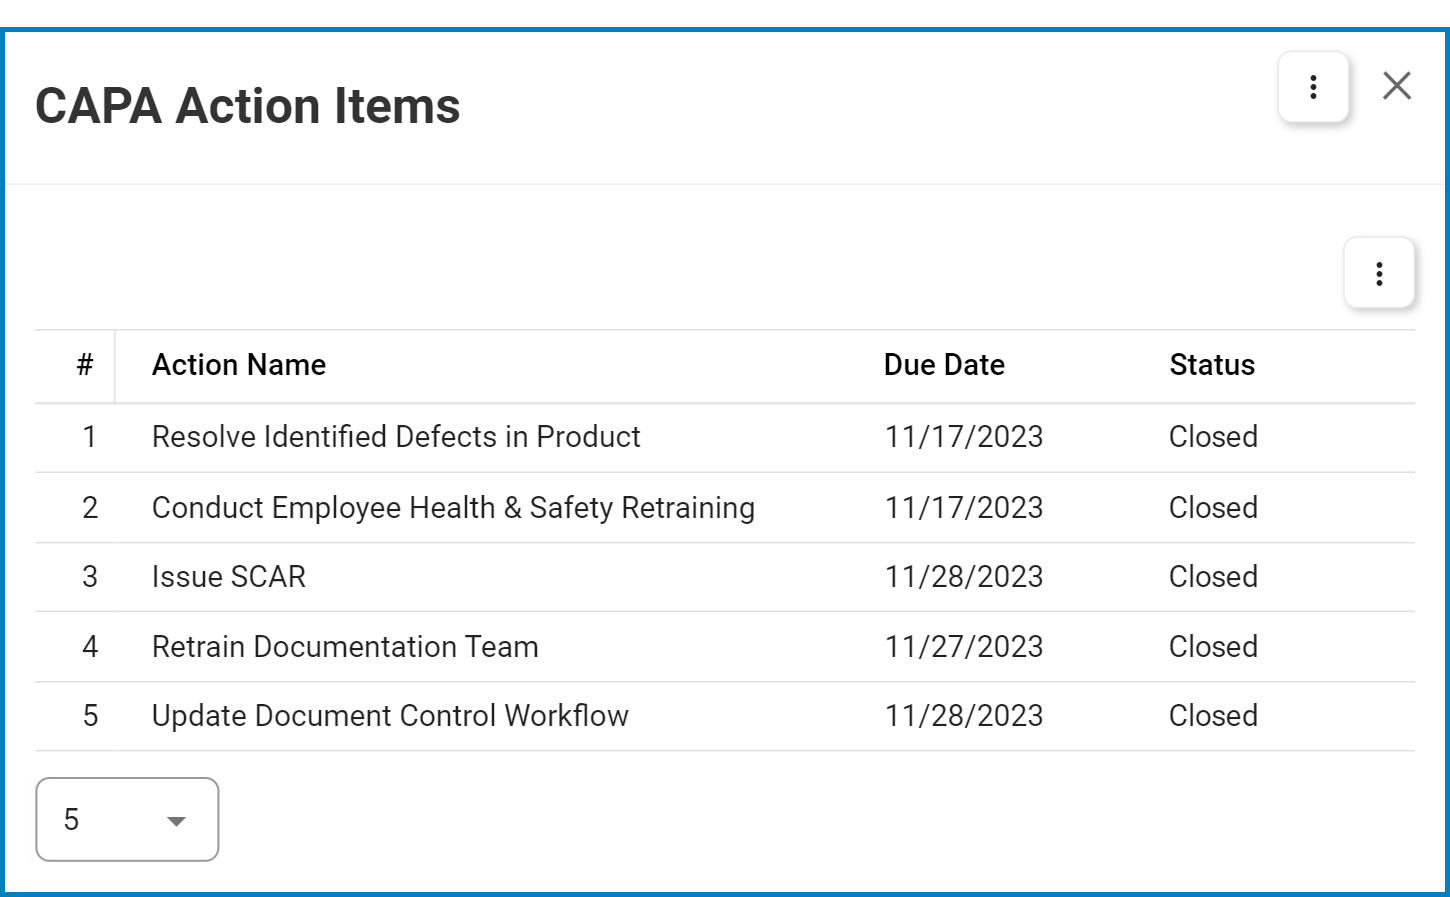
- Drilldown Reports: These are data reports that users can access by double-clicking on the different symbols in the pie charts. (Symbols, in this case, refers to the slices/sectors of the pie charts).
- For example, if users were to double-click on the sector representing action items whose deadline has not yet passed, a pop-up window would appear with the following form:
![]()
- For example, if users were to double-click on the sector representing action items whose deadline has not yet passed, a pop-up window would appear with the following form:
Post your comment on this topic.