
The target preference page is automatically filled in according to the tool chain selected by the user. The type of debugger you can choose depends on your toolchain analysis settings.
To build an IAR Embedded Workbench, enter the required information in the Analysis and Build tab of the target preferences and click Done.
The contents to be filled out are as shown in the table below, which is mandatory.
- Analysis tab
cpu CPU of target that can be selected from Core of Processor variant
- Build tab
ide_directory_path Installation path of the IAR Embedded Workbench IDE ex. C:\Program Files (x86)\IAR Systems\Embedded Workbench 8.4 project_file_path Project file (.ewp) path of IAR Embedded Workbench
If you click the Done button on the target preference page without writing all the contents or if the path has been changed, you can set it again at ‘Right click on the project in the test navigator-> Properties-> Test target-> Target environment’.
After setting the target environment and clicking the Run button in the unit test view, the controller tester builds the target test code.
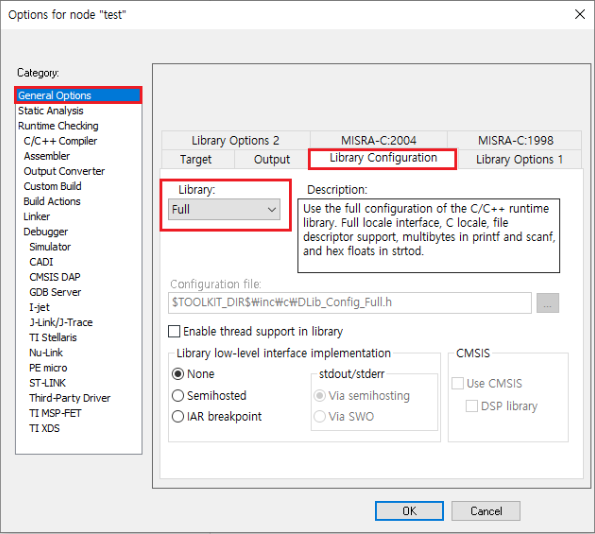
*When using the IO function of stdio.h, it is necessary to change the library settings.
Right click on the project in the workspace -> Options -> General Options -> Library Configuration -> Library tab and change it to Full.
Need more help with this?
Don’t hesitate to contact us here.