
If you click on Monitor(s) you have a visual overview of all sectors within a location by color coding the individual tiles.
This view is opened in a separate window, that it can easily be shown on an external (second Screen) for monitoring purposes.
| Color | Status | Display |
|---|---|---|
| green | actual temperature wihtin set limits |  |
| red | actual temperature outside set limits |  |
| yellow | Sector offline |  |
Temperature Monitor Description
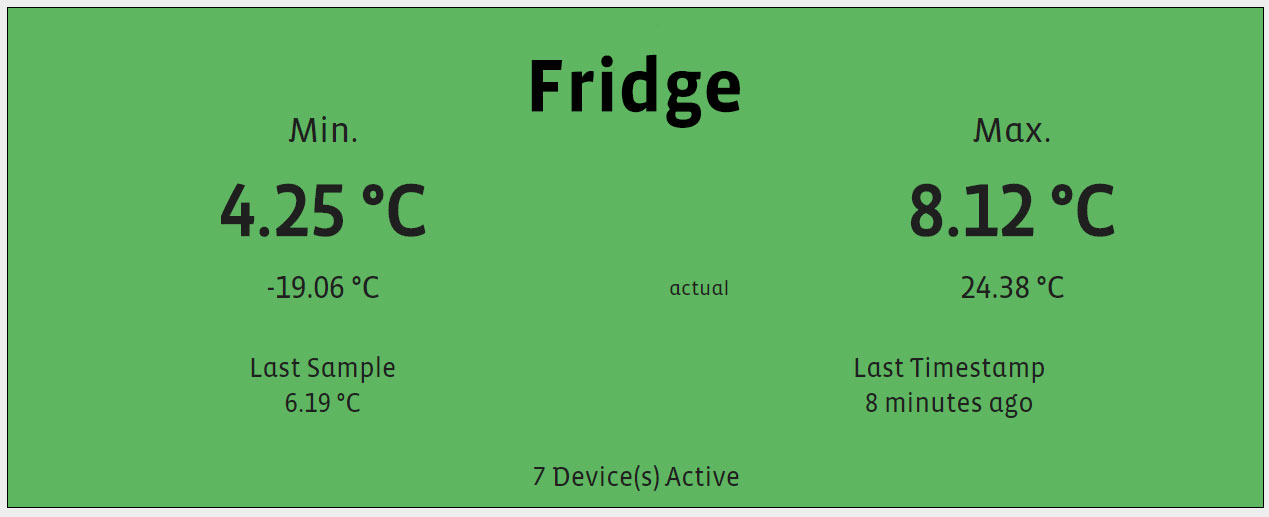
- The figures of the big letters (in this example 4.25°C and 8.12°C) show the minimum and the maximum measured temperature over the last 24 hours.
- The small figures above (actual) show the minimum (4.24°C) and the maximum (8.12°C) measured temperature of the last timestamp.
- The last sample indication shows the temperature of the most recent device, which is in this example 6.19°C.
Copyright © 2025 Berlinger & Co. AG
—
Powered by 