Interactive Chart control is use to create Dashboard. Dashboards are used for Data visualization by displaying KPIs. A form contains data visualization controls.
Data visualization controls could be Charts, Tables or Grids.
Types of charts : Pie, Column, Line, Point.. etc.
Drilldown could be applied
Steps in doing an Interactive Chart
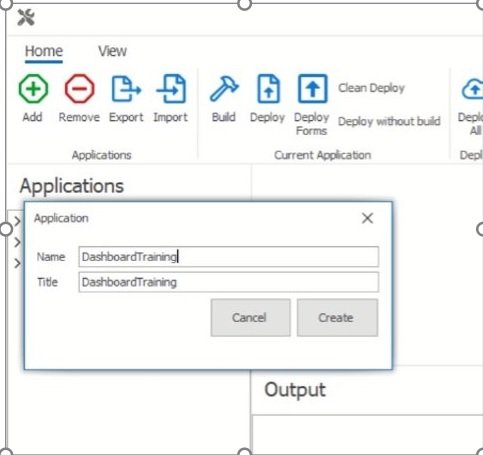
- Create a new application. Provide the name and title.
![]()
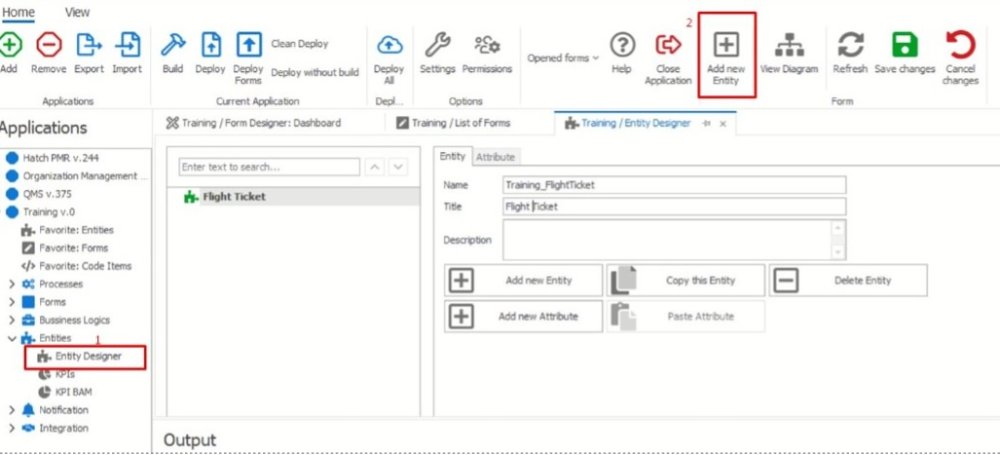
- Create a new Entity.
![]()
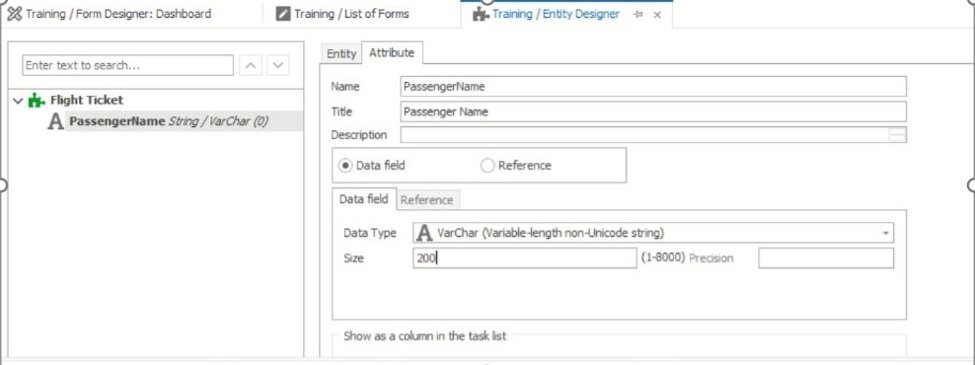
- Create entity properties.
![]()
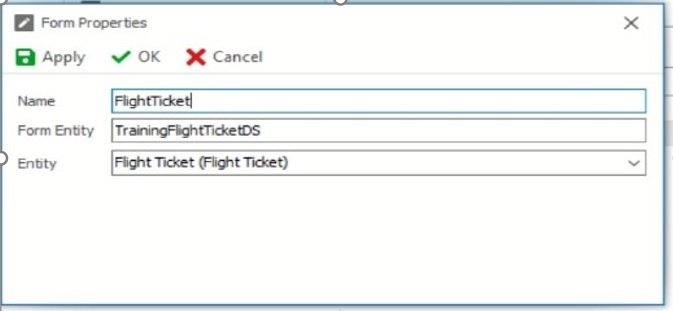
- Create Form from Entity
![]()
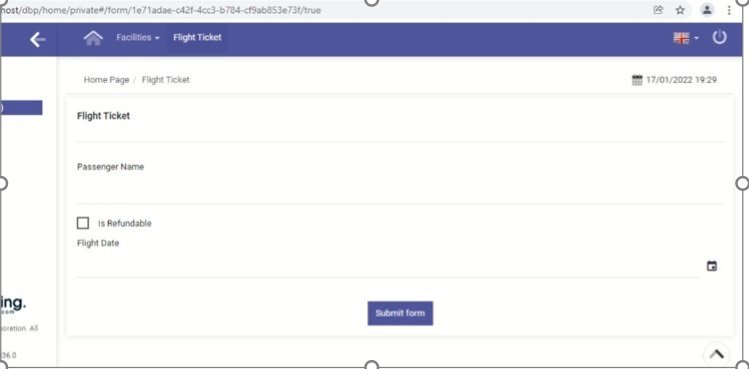
- Enter data
![]()
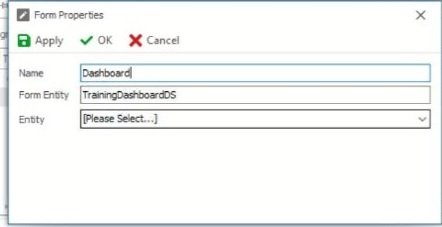
- Create Dashboard form
![]()
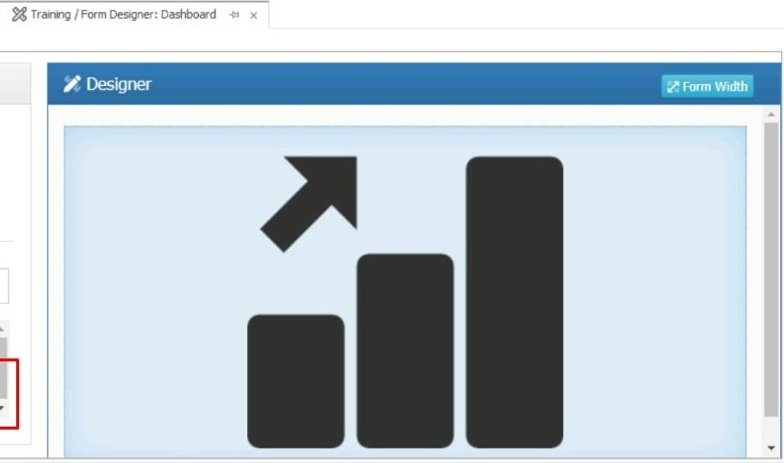
- Drag and drop Interactive chart control
![]()
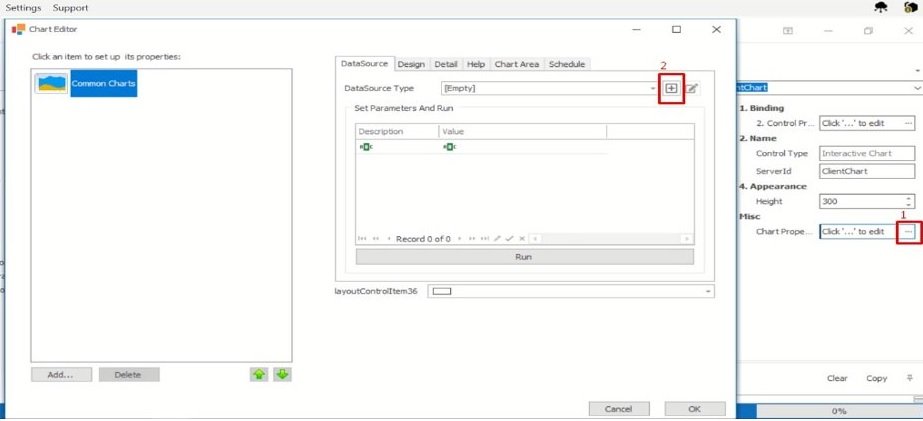
- Chart properties. Open chart properties and click on add data source type.
![]()
- KPI
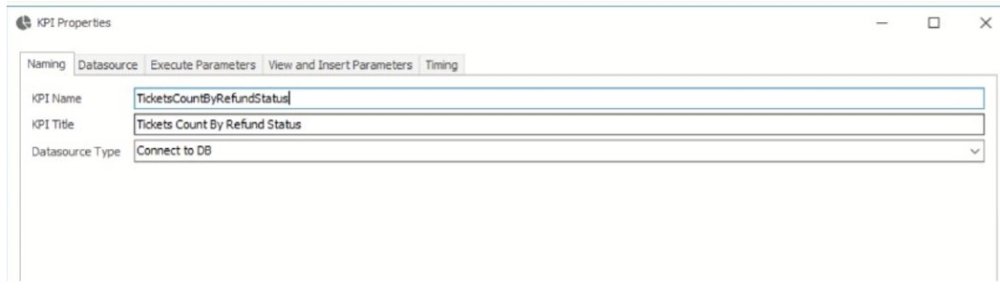
- Give the KPI a name and Title.
![]()
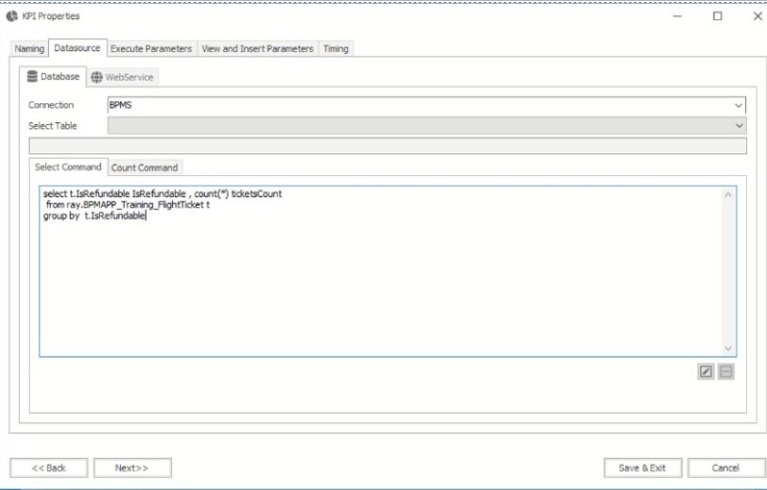
- Write a query.(You can get name of a table by adding “BPMAPP_” prefix to EntityName)
![]()
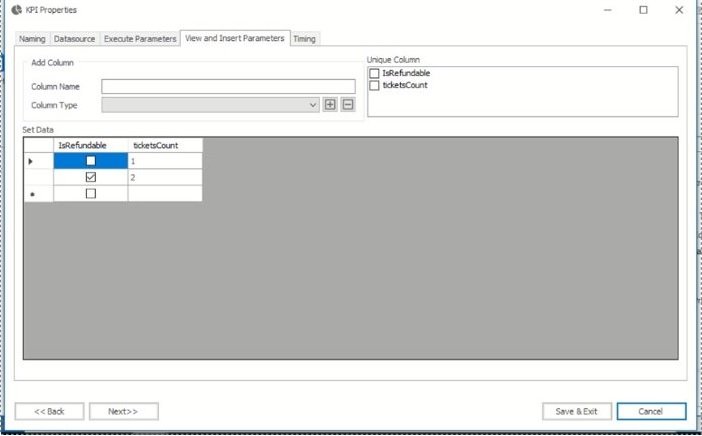
- Click on Execute then Click on “Save & Exit”
![]()
- Give the KPI a name and Title.
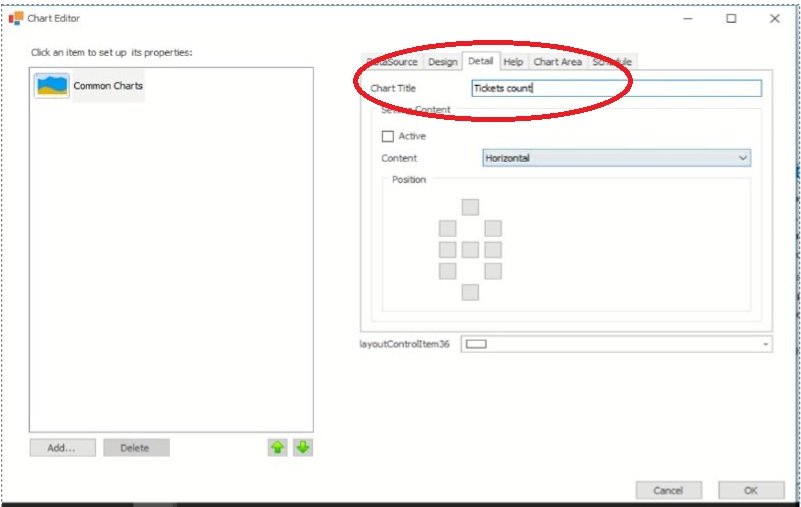
- Give the chart a Title
![]()
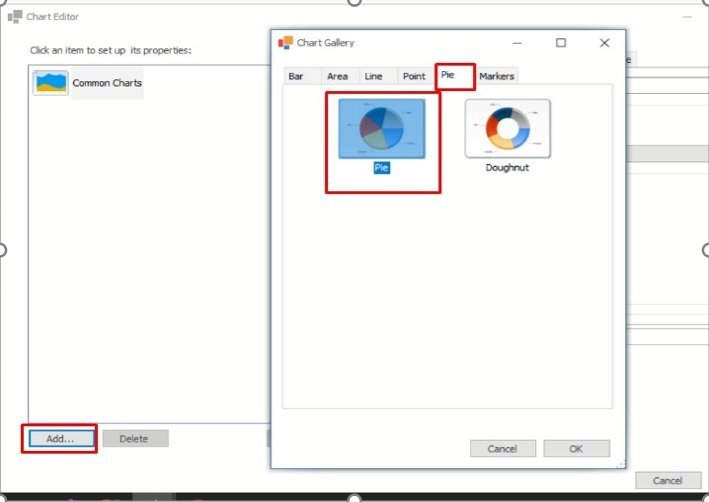
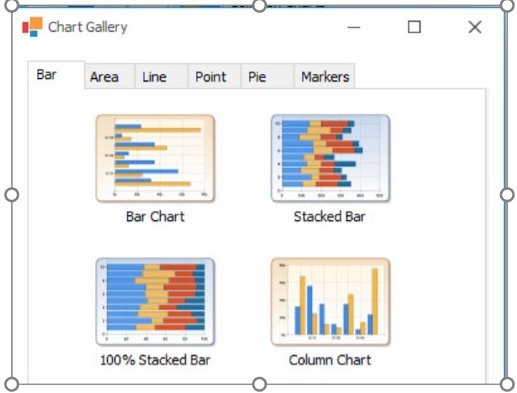
- Add pie chart(Could be bar, line, etc depending on what you need and requirement)
![]()
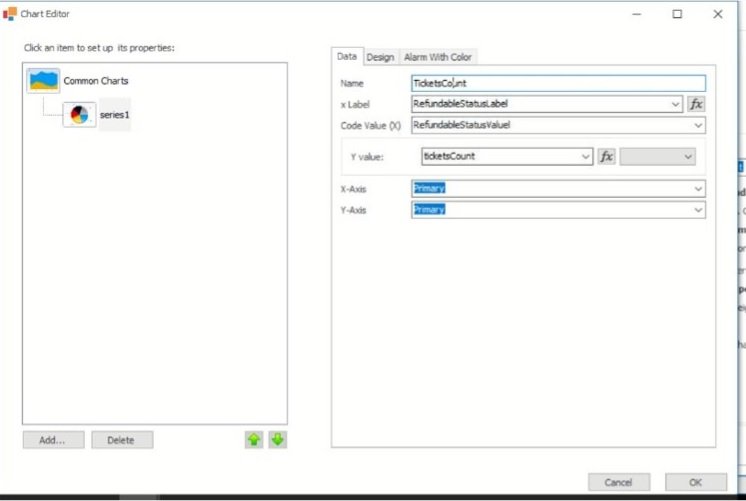
- Select label and Value columns. These labels are available in the dropdowns and based in the query in the KPI.
![]()
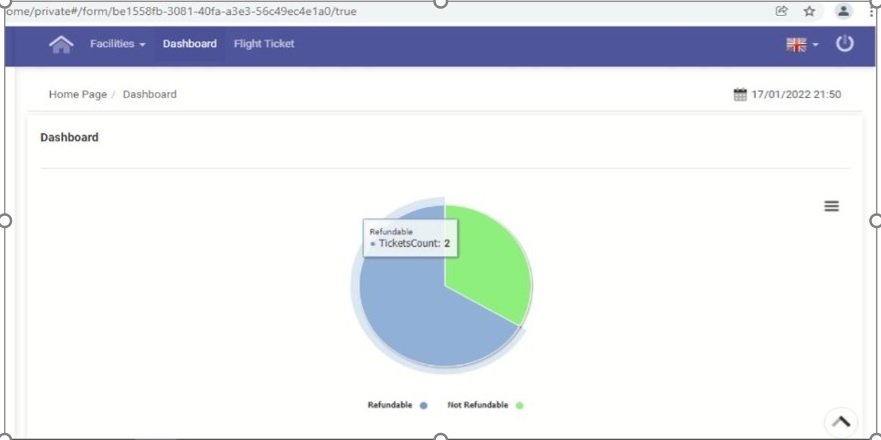
- Deploy and Open dashboard
![]()