
Measuring Your Business as Usual (BAU) Scenario
The first step toward becoming Net Positive is to determine the cradle-to-gate impact of production, or Footprint. To qualify and quantify measurable change that results from the creation of Handprints, we need to determine the baseline — “business as usual, or BAU — Footprint scenario for comparison. For well-established products with a sales history, a simple and reasonable BAU scenario is responding to this year’s demand for the product with last year’s version of the product and its cradle-to-gate production processes. For new products, such as from a start-up company or from new product development at an established company, BAU reflects the processes and decisions that would have been incorporated without interference or updates to typical protocols.
Calculating the BAU Footprint is accomplished by developing a life cycle assessment (LCA) model that reflects BAU production. While manufacturers may have already introduced improvements and efficiencies in the past, production protocols can and do change often, so it is important to use an accurate representative baseline as the BAU reference. Some manufacturers use internal resources to complete LCAs, while others will look to consultants or other partners for this service.
The LCA should be completed to cradle-to-grave scope, which identifies and quantifies associated impacts from the point of raw materials extraction to final disposal and end-of-life of the product. The LPC then asks manufacturers to create Handprints that are greater than the cradle-to-gate portion of this life cycle, the product’s cradle-to-gate Footprint. Three LCA midpoint impact categories are considered for the Water, Energy and Materials Petals of LPC: water consumption, fossil fuel depletion and global warming. Impacts in one category are not additive with impacts in another category.
Cradle-to-Gate Impact as Footprint
The Footprint of a product is calculated at the scale of a defined functional unit, and is determined as part of the LCA model. The functional unit is a quantified description of the performance requirements that the product or product system fulfills. For example, this may be the carbon Footprint of 1 chair with a warranty of 15 years, or the water Footprint of a square meter of carpet with a life expectancy of 50 years. The impact per functional unit multiplied by production volume, which is generally calculated or predicted annually, provides us with the Footprint. It is this Footprint that must be offset in order to achieve life cycle Net Positive within the requirements of the Living Product Challenge. Net Positivity in relation to the cradle-to-gate scope means that the positive impacts in the world that are created by producing the product exceed the negative impacts caused by producing it.
Identifying and Implementing Opportunities for Impact Reduction
Once an LCA has been completed, and the relevant product Footprints have been identified, we would caution those seeking Net Positive impact to not skip over the next two steps to start Handprinting. Handprinting before you try to increase efficiency and reduce your Footprint is like installing solar panels for an energy-guzzling building: it is costly and wasteful. Naturally, many manufacturers that have been working on sustainability for years will have identified many impact reduction opportunities by the time they take on LPC, but these opportunities should also be reviewed again for the potential to further decrease the size of the Handprint.
Producing an LCA is an investment and should be leveraged to “activate” the information provided to shrink a product’s Footprint and realize production efficiencies and cost savings. Many LCA practitioners and sustainability firms specialize in identifying these opportunities and working with manufacturers to take meaningful action.
Hotspots as Reduction Levers
Whether using an existing LCA or conducting a new one, LPC asks manufacturers assessing their cradle-to-gate impacts to go beyond only quantifying a Footprint value by working with the LCA creator to identify “hotspots” or key drivers of impact. These Hotspots make major contributions to one or more impact categories. Upstream processes may be the best places to start looking for improvement opportunities, such as more efficient use of water or energy. Promoting or enabling actors in the product’s supply chain to implement such innovations is a powerful way to reduce a product’s Footprint. It should also be noted that when the innovation also affects the impacts of other manufacturers, these benefits outside the scope of the manufacturer’s Footprint become part of a product’s Handprint (Handprint accounting is described in more detail in the next section).
Case Study: Bureo Skateboard Hotspots
As an example of hotspot identification, the figure below models the climate change (or carbon) Footprint of a Bureo skateboard, composed primarily of NetPlus+ Material, a plastic input made from recycled fishing nets. Bureo ultimately chose to more broadly certify its NetPlus+ Material rather than just the skateboard, but this case study represents the pilot exploration of the skateboard’s climate Footprint.
The figure illustrates the relative influence of supply chain processes in relation to the climate change impact category. The highest single contributing process to climate change impacts is the red circle, representing the manufacturing of (virgin) Nylon 6 with glass fiber reinforcement. The next two largest circles are each for the combustion of coal to provide electricity, which is used in recycling of the fishing nets and the manufacturing of the boards. The large contribution of impact from these hotspots suggests that they may directly or indirectly offer key opportunities to reduce the product’s Footprint and create a Handprint.
In light of this information, Bureo introduced additional product design innovations that enabled the use of 100% recycled feedstock, further reducing its environmental Footprint
and increasing the demand for recycled fishing nets. Also, given the importance of electricity
used in the recycled plastic processing and new product manufacturing, Bureo pursued changes to manufacturing processes which increase electricity use efficiency. Both of these changes reduced the product Footprint, moving it closer to Net Positivity.
Product manufacturers can repeat this process through the lens of different impact categories to continue minimizing their overall Footprint.
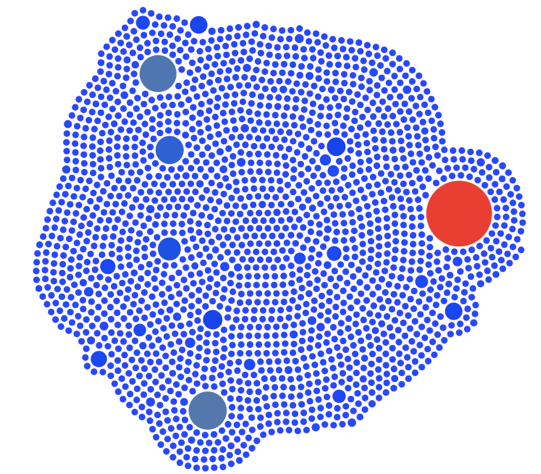
Modeling the life cycle of a Bureo skateboard, the figure (an analytical output of the open-source openLCA software) illustrates the relative influence of supply chain processes in relation to the climate change impact category. The red circle represents the manufacturing of (virgin) Nylon 6 with glass fiber reinforcement, which is the skateboard’s highest single contributing process to climate change.
It should be noted that while LCA models may identify certain materials or processes as hotspots of one or more impact areas, these may not be the best opportunities for creating meaningful Footprint reductions. For example, for a bio-based product, an agricultural material may be identified as one of the key drivers of water use, but this material is integral to the success of the product, or it has multiple other positive benefits that cannot be seen within the water footprint. This is of course the reason that LCA professionals advocate for looking at environmental impacts holistically, rather than extracting one number in isolation.
Additionally, as noted previously, changes that reduce the Footprint in one impact area may have the additional benefit of reducing other Footprints, but it can also be the case that reducing one Footprint within the life cycle can come with Footprint increases to another impact area. Ultimately, these situations become judgment calls for the manufacturer and LCA experts to make if tradeoffs cannot be avoided. The context of where a material is extracted, processed or produced may of course influence how one interprets the LCA results. Higher water impacts in a rainfall-rich area could be a preferable impact to high carbon emissions or biodiversity consequences.
Once the manufacturer has determined its impact category Footprints, identified and implemented reduction opportunities, it is left with new Footprint values wherever they have taken impact. The value of these updated Footprints is what is used to identify the scale of Handprint required to become measurably Net Positive in LPC.