
Stacked Charts are used to show the total of multiple data series within a set while still being able to identify how much of the total is coming from each series. An example of a use case for this would be displaying total profit and being able to identify how much of the total came from which revenue source. The five types of Stacked Charts available in the web part are shown below.
| Stacked Column 2D | 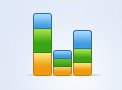 |
| Stacked Column 3D |  |
| Stacked Area 2D | 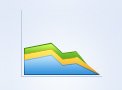 |
| Stacked Bar 2D | 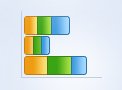 |
| Stacked Bar 3D | 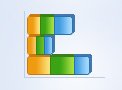 |
Feedback
Copyright © 2025 Lightning Tools
—
Powered by 
Post your comment on this topic.