
Depending on the age, source or generation method of your data source, it may contain outdated or unnecessary information. If that is the case you can use the Filter Data page to remove what is not required from the source prior to generation of the chart.
To do this you can create multiple filters based on the data fields that you have chosen to include from the source and set specific requirements for each one. An example of some of the types of filters that you could use is included below:
Create and apply a new filter
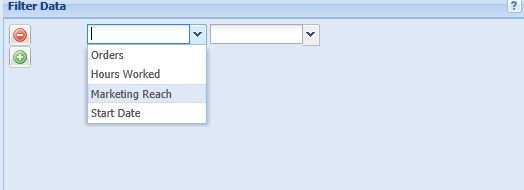
To create a new filter first click on the  icon and then select which data field you wish to filter on from the dropdown menu. For the first filter on a chart you will not need to use the add icon to create the new filter as dropdown menu will already be there. If you do not wish to filter your data simply leave this box blank and continue with configuring your chart.
So for example if you had information showing the number of people reached by different marketing campaigns and only wanted to show entries for those that had reached 200 or more people, you would first create a filter on the relevant column.
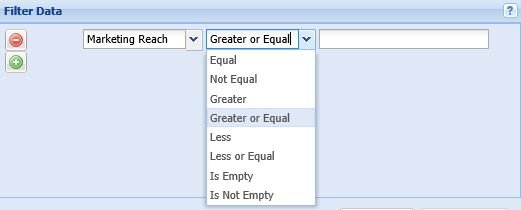
Then set the filtering function to Greater or Equal from the next dropdown menu.
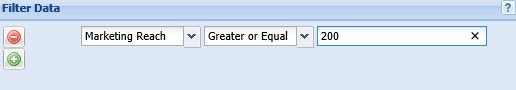
And then lastly, enter the value of concern to the textbox at the end, in this case 200.
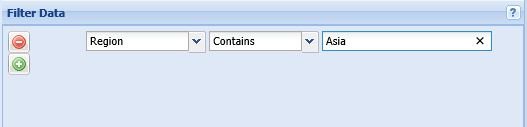
In a similar manner if you want to filter on a field containing text rather than numeric values, you would select the column, then the filter type and lastly the text that is to be filtered on. In the example below the column Region has been filtered so that only entries containing the text Asia somewhere in that column are shown.
Once you have chosen all of your options click Apply for them to be confirmed and applied to your data source. A table below the filters will show you what data remains after filtering.
Managing multiple filters
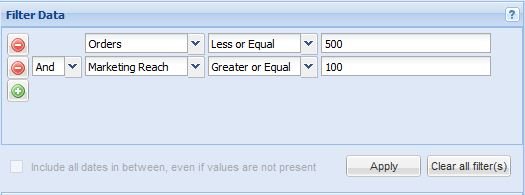
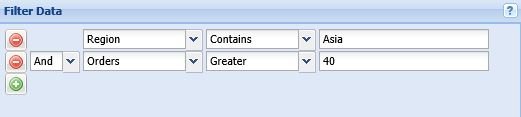
Additional filters can be applied on top of each other to the same data source so that only those entries meeting the requirements of all specified filters are shown. For example you may want to see the entries for orders over a certain volume within a specific region.
In this case you would create the first filter as before, and then after clicking the symbol to add another filter, you would need to select And in the additional dropdown menu that now appears at the start of the filter options before filling in the rest of the menus as normal.
Alternatively, the first dropdown menu can be set to Or. In which case entries meeting the requirements of either of the specified filters will be used to generate the chart.
Deleting a filter
Filters can be removed at any time by clicking the  button on the left hand side of the filter options.
Apply filters to numbers
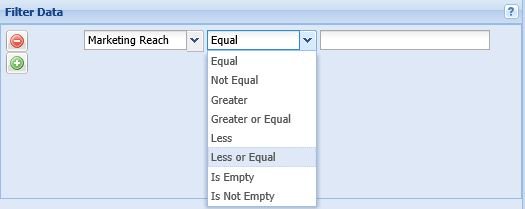
When filtering numbers you can use the following filters: Equal, Not Equal, Greater, Greater or Equal, Less, Less or Equal, Is Empty and Is Not Empty.
The steps for setting this type of filters is: select a field of the appropriate type, then choose a filtering condition and lastly provide the value to be used.
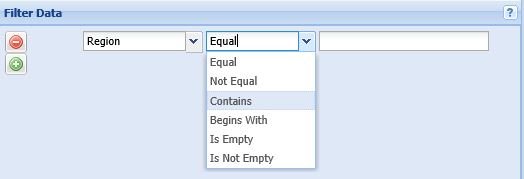
Apply filters to text values
When filtering text values the following filters are available: Equal, *Not Equal, Contains, Begins With, Is Empty and Is Not Empty.
Apply filters to dates
When filtering dates you can use the following filters: Equal, Not Equal, Greater, Greater or Equal, Less, Less or Equal, Is Empty, Is Not Empty, Is Between, Is, Is Previous and In Past (incl. today).
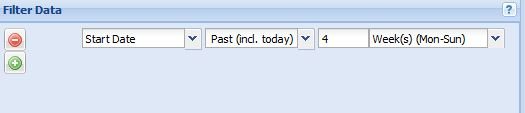
So in this example if I wanted to filter for all entries that began in the previous four weeks, I could select to filter on Start Date and then set the filter to “In Past (incl. today)”. Then two new boxes will appear allowing me to input a number and a calendar unit, in this case “4” and “Week(s) (Mon-Sun)”.
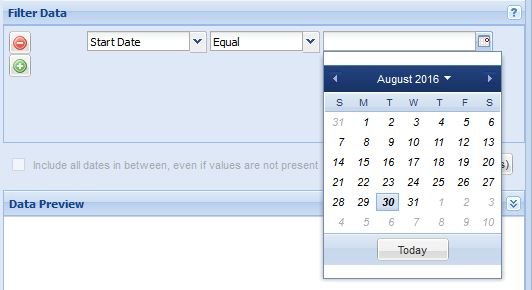
For other filters based upon dates you may choose to filter based on a specific date rather than a period of time relative to the present. In which case you may type the date into the selection box at the end or choose it from the dropdown calendar that appears.
Adding empty records for missing dates
Date based filters can only detect records for those dates that are present in the data source. This can result in missing values due to them lacking a corresponding date.
To add empty records for the missing dates simply check the box for Include all dates in between, even if values are not present.

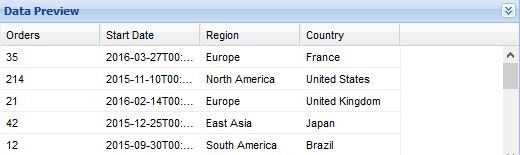
Data Preview
Once you have applied your filters to your data a preview box below the filter options will show you what data will be used to build your chart.
Post your comment on this topic.