The Chart Web Part can be configured to display data from another web part on the same page. As an example, you may be using the Lightning Conductor Web Part to rollup tasks from multiple sites, and would like to display in a pie chart, the ratio of those tasks based on status. Furthemore, you may want to show how many tasks are In Progress, Completed, or Not Started.
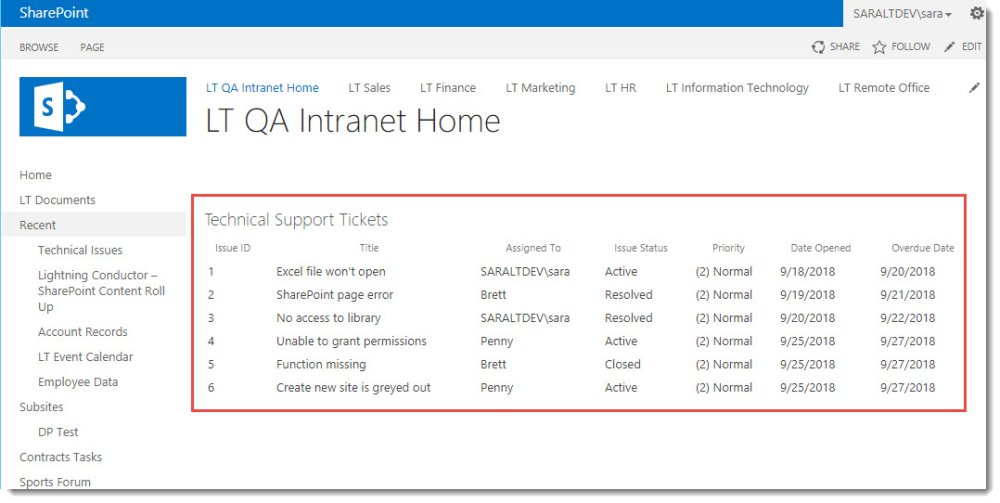
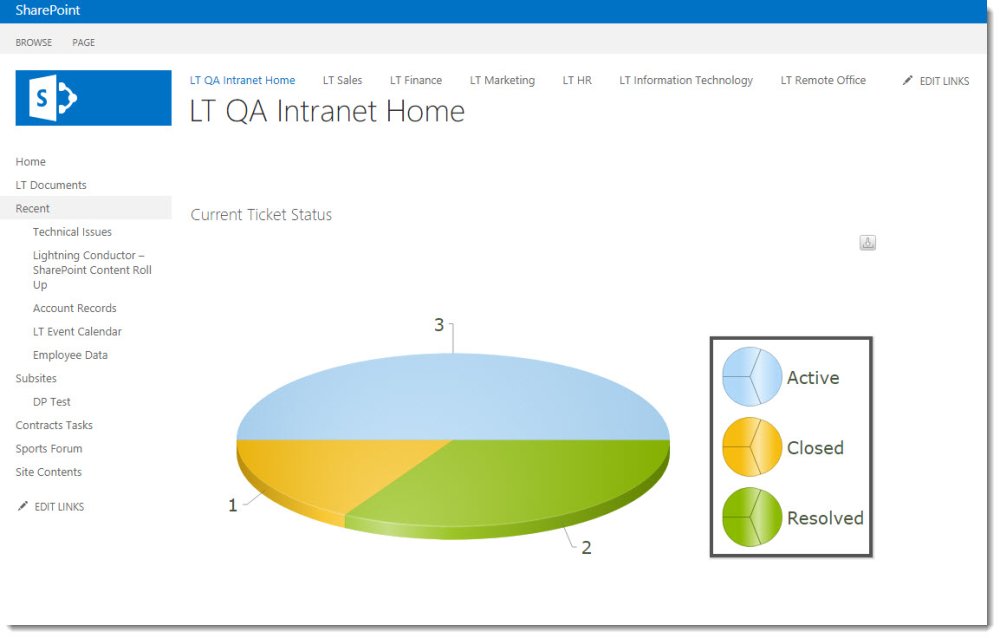
The example below shows the Lightning Conductor Web Part displaying tasks for Technical Support Issues (e.g. items from Issue Tracking Task Lists), and using the Chart Web Part to show how many tasks are currently Active, Resolved, or Closed. To do this, follow the steps below.
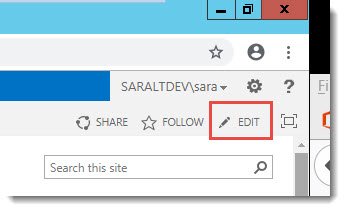
- First, Edit the SharePoint page
- Next, add the Lightning Conductor Web Part to your page and configure as required.
In this example, I’ve added a Lightning Conductor web part called Technical Support Issues to the current page.
- Add the Chart Web Part to the current page.
- Click the drop-down for the Chart Web Part options and choose Edit Web Part.
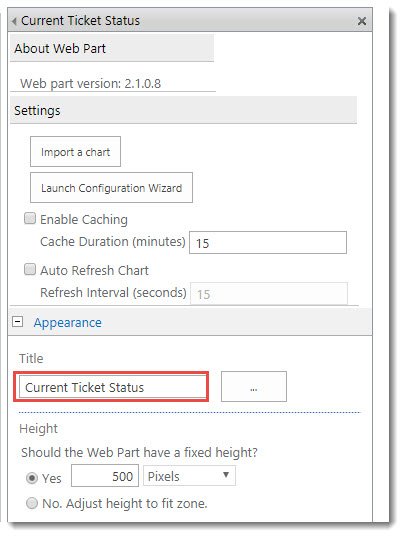
Here you can also configure the web part title under the Appearance Setting. In this example, I’ve given the title “Current Ticket Status”.
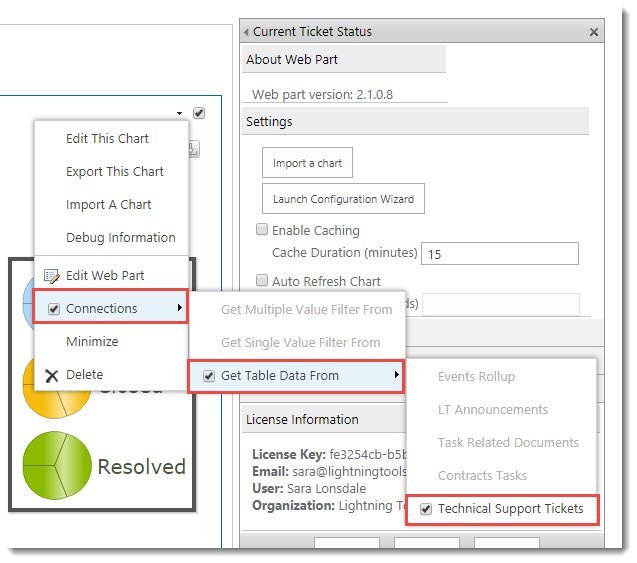
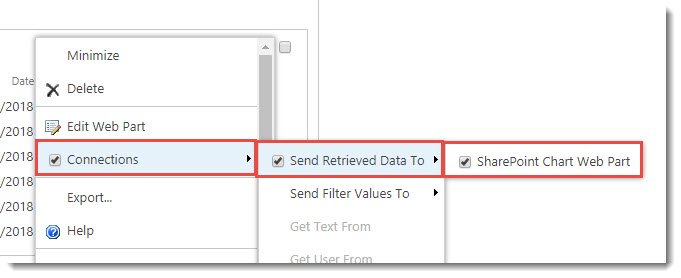
- Click the web part drop-down again and choose Connections—>Get Table Data From—>“Lightning Conductor Web Part”. In this example, the Lightning Conductor Web Part is Technical Support Tickets.
You may also notice that if you follow the same steps on the Lightning Conductor web part, you will also see the Connection to the Chart Web Part.
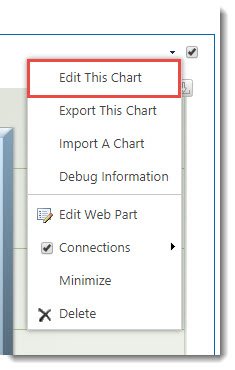
- Click the Chart web part drop-down a third time and choose Edit This Chart.
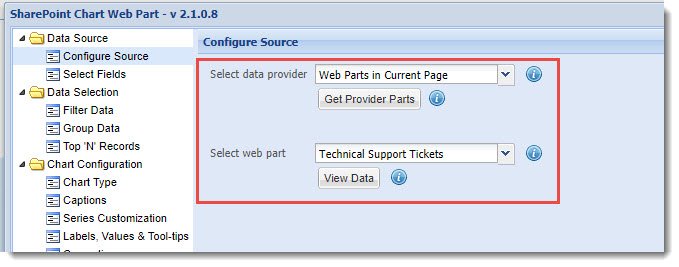
You should see on the Configure Source page that the Data Provider is set to Web Parts in Current Page and the Web Part is Technical Support Tickets that we connected to in the previous step.
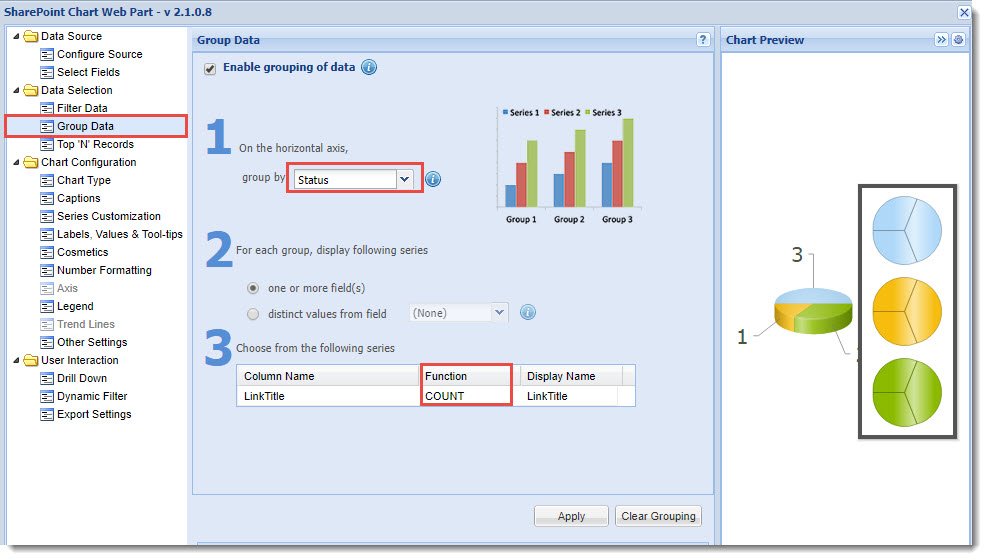
- Configure the Chart Web Part as required. We’ve chosen to Enable Grouping of Data by and group by Status (Step 1), and selected COUNT as the Function (Step 3), so it would count the number of issues in each status. Lastly, we selected Pie 3D as the Chart Type, removed the Labels, and added a Legend.
- Click Finish once you’ve completed your chart configuration.
- Save the SharePoint page.




Post your comment on this topic.