
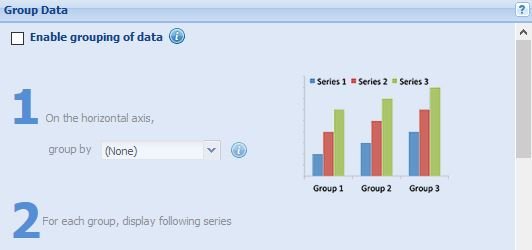
In the Group Data section you are able to certain entries together based upon values that they have in common. Situations in which this may be useful is if you have entries for certain regions or individual years that you want to be grouped together so that it is easier to compare relative results.
For example you may want the total orders for each region combined together to give an overview of how each area has fared rather than viewing each one individually.

In order to do this you need to the following:
- First, check the box for Enable grouping of data.
- Next, select the field that you wish to group by for the horizontal axis, in this case Region.
- Ensure that the radio button for one or more field(s) is selected, it should be by default.
- Select the SUM function for the Orders column.
- Lastly, click Apply.
You should see a summary of your grouped data in a table below the settings options.
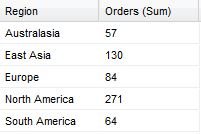
In addition to SUM there are four other functions for grouping and aggregation. The names of the functions and their properties are as follows:
- SUM; the combined total of all the values in the group.
- AVERAGE; the average of all the values in a group.
- COUNT; the number of values listed in the group.
- MIN; the lowest value in the group.
- MAX; the highest value in the group.
Split data from a single column into multiple columns.
It is possible to create multiple data columns from the values included in a single data column. For example, all date values are entered into the same column rather than having separate columns for different months or years. Therefore if you want to view the data grouped by certain dates, you can split the date column into separate columns for each month or year.
In this example we want to view the amount of orders, per region, per year.
In order to split the data appropriately you need to do the following:
- As before select Region to be grouped on the horizontal axis.
- Then tick the distinct values from field radio button and select Year from the dropdown list presented to you.
- Next select SUM from the first dropdown list under For each series, display.
- Lastly, you select Orders for the second dropdown box under For each series, display.
This should produce a table that looks somewhat like the following:
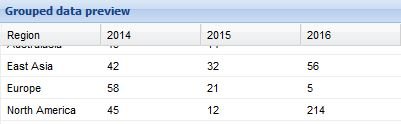
Which should produce a chart such as this:
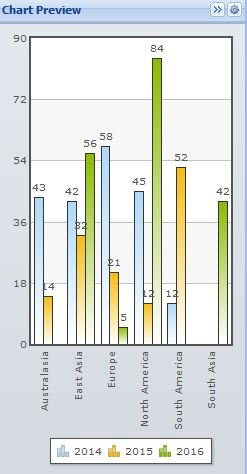
Please note that in the chart each individual year is considered a data series.
Grouping dates.
Use the following steps to summarise data using a specific part of a date, including: year, half year, quarter, month, day, hour, minute or second:
- Select a column with a Date/Time value for On the horizontal axis, group by.
- Next, select a value of date or time from the dropdown list for where dates are grouped by the.
- Finally, select a summarising function (SUM, COUNT, etc.) and apply to the columns provided in the table under Choose from the following series.
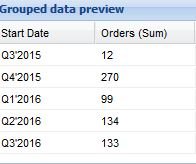
The table produced by this method should look something like the following:
Post your comment on this topic.