
The first screen that you will see when selecting the chart’s configuration wizard will ask you to select your data source and then which parts of that source you wish to draw information from.
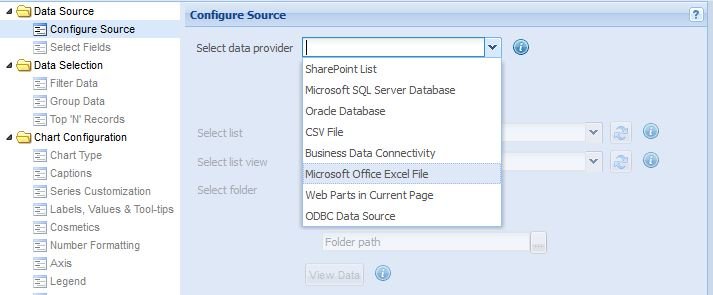
From here you can select from one of the data source types in question and direct the Chart web part to the location of the data source. Once the data source is selected, you can choose from which section of the source you wish to draw information.
SharePoint Lists
Microsoft SQL Database
Oracle Database
CSV Files
Business Data Connectivity sources
Excel Files
Web Parts on the same page
ODBC Data Sources
Selecting from a SharePoint List
To connect a SharePoint List to the chart in order to provide data you should use the following steps:
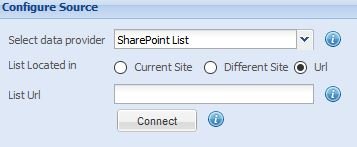
- Select the SharePoint List option from the Select data provider dropdown menu.
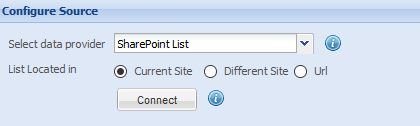
- Now, use the radio buttons to inform the configuration wizard whether the list is located in the Current Site or a Different Site. Alternatively you can give the wizard a direct Url link.
- Current Site: to be used when the required list is located on the same site as the Chart web part is located.
![]()
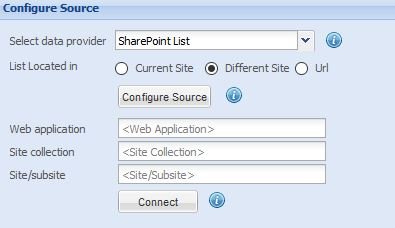
- Different Site: to be used when the list is located on a separate site from the Chart web part.
![]()
When this option is selected you will need to provide the Web Application, Site collection and Site/subsite of where the list is located. To do this:
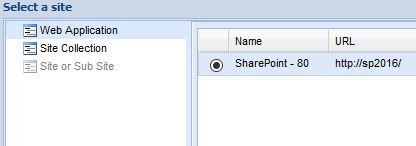
- First, click on Configure Source, this will cause the Select a site window to appear. Select the Web Application in question and then click Next.
![]()
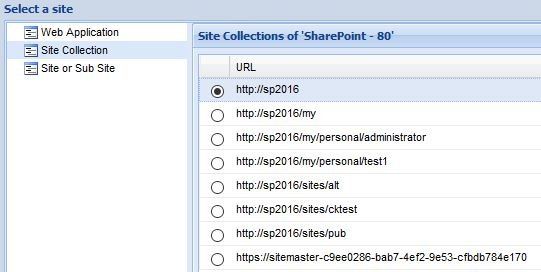
- Next, select your site collection.
![]()
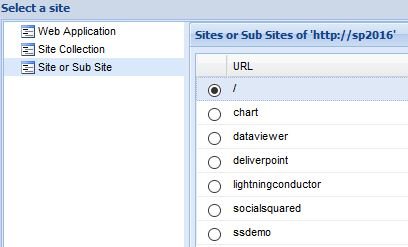
- Finally choose the site or sub-site within the site collection and then click Finish.
![]()
- URL: used to connect directly to a specific SharePoint List URL.
![]()
- Once you have configured the list location that you want to use click Connect. If the connection is successful a message box like the one below will appear.
![]()
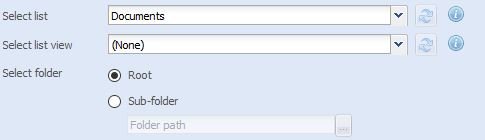
- You can now select the specific list that you want from the Select list dropdown menu.
![]()
- Optionally you can select a particular view for the list that you want to use from the Select list view menu.
- If the selected list contains folders the Select folder option will be activated. By default Root is chosen and draws data from the top level of the list.
![]()
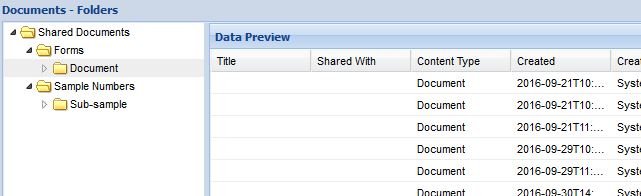
- If Sub-folder is selected you are then able to choose from any of the List’s folders and sub-folders. A pop-up window will allow you to navigate the available folders and select the one you wish to use.
![]()
- Once you have decided on the folder you wish to use you can opt to include data from all of it’s sub-folders and then confirm your decision by clicking Select folder.
![]()
- Once you have finished configuring your data source click View Data to review the data that will be used.
![]()


Selecting from a Microsoft SQL Database
You can connect a chart to a Microsoft SQL database using either SQL Server Authentication or Windows Authentication.
Connecting with SQL Server Authentication
SQL Server Authentication is the default authentication method and requires you to provide your credentials every time that you connect to the database.
Use the following steps to configure a SQL connection:
- Enter the address of the SQL server that you want to use.
![]()
- Then the name of the database you want to access.
![]()
- Next enter the user credentials required to access the database.
![]()
- When you click Connect a message box will inform you if you were successful.
- Once connected you can select a Table or View from the database to use by selecting the radio button for the type and then making your choice from the dropdown list or apply a SQL query to the database to refine the data you need.
![]()


Connecting with Windows Authentication
Instead of using SQL authenticaion you can verify your identity with the Windows Authentication instead. In this case you will not need to supply a username or password.
- Enter the address of the SQL server that you want to use.
![]()
- Then the name of the database you want to access.
![]()
- When you click Connect a message box will inform you if you were successful.
- Once connected you can select a Table or View from the database to use by selecting the radio button for the type and then making your choice from the dropdown list or apply a SQL query to the database to refine the data you need.
![]()
Using the SQL query option
When you choose to use the SQL query to provide data from the database to the chart there will be two text boxes named Query Variables and Query that appear.
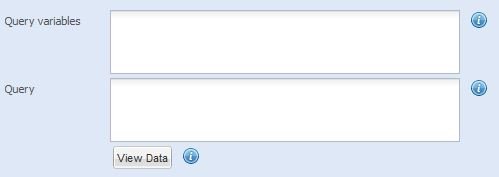
You now need to enter your SQL Query into the Query box to select the data. You also have the option to use the Query Variables box to set predefined values for declared variables. You can then use these variables as part of the SQL query.
So you could set the following the following in the Query Variables box to define an age limit.
DECLARE @AGE_LIMIT int
SET @AGE_LIMIT = 18
Then in the Query box you use the following to select the entries which exceed the age limit value you have set.
SELECT NAME, ADDRESS, PHONE, RATING FROM VISITORS
WHERE AGE >=@AGE_LIMIT
When you have finished entering your choices click View Data to apply the SQL query and view the retrieved data.
Selecting from an Oracle Database
To set up a chart to retrieve information from an Oracle database use the following steps:
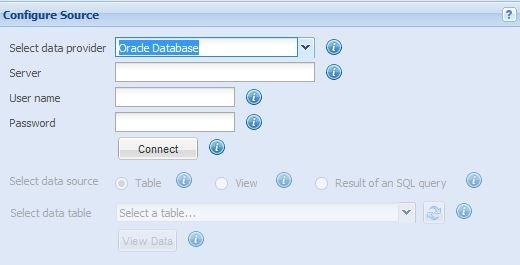
- First select Oracle Database from the data provider dropdown menu.
- Enter the name of the database server into the Server textbox.
- Provide the appropriate information in the User name and Password textboxes.
- Now, click Connect and a message box will appear to tell you if the connection was successful.
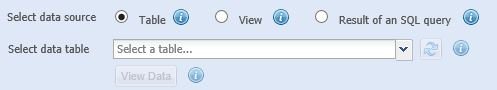
- Once a connection is made you are able to choose from selecting a Table of data or using the Result of an SQL Query to provide the data for the chart.
Table: when you select to use a table of data the Select data table dropdown list becomes available. Select the table you wish to use from this dropdown.
When you have chosen the table you wish to use click View Data to confirm and view the retrieved data.
Using the SQL query option
When you choose to use the SQL query to provide data from the database to the chart there will be two text boxes named Query Variables and Query that appear.
You now need to enter your SQL Query into the Query box to select the data. You also have the option to use the Query Variables box to set predefined values for declared variables. You can then use these variables as part of the SQL query.
So you could set the following the following in the Query Variables box to define an age limit.
DECLARE @AGE_LIMIT int
SET @AGE_LIMIT = 18
Then in the Query box you use the following to select the entries which exceed the age limit value you have set.
SELECT NAME, ADDRESS, PHONE, RATING FROM VISITORS
WHERE AGE >=@AGE_LIMIT
When you have finished entering your choices click View Data to apply the SQL query and view the retrieved data.
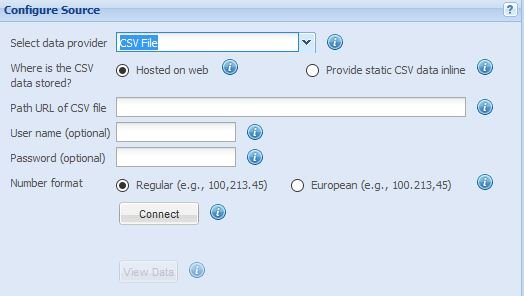
Selecting from a CSV File
To pull data for the chart from a .csv file first select CSV File from the Select data provider dropdown menu. You will then be provided with the option of linking the webpart to an online .csv file or simply pasting the information of a file into the configuration wizard.
Hosted on web
For this method you will be presented with fields to fill for Path URL of CSV file, User name and Password, the last two of which are optional fields depending on whether the file requires it. Once you have entered the required information into the fields click Connect to confirm the settings, a message box will appear to tell you whether the connection was successful.
Provide static CSV data inline
If you choose this option a large textbox will appear below the data provider dropdown list for you to past the contents of your .csv file into. Once you have done this click Parse Data and a process bar will appear while the wizard process the information.
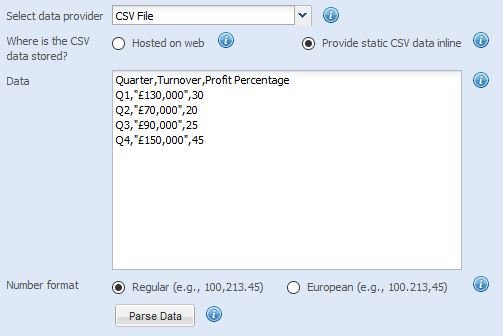
Once this is done you can click View Data to see the processed data and confirm it has come out correctly or click on Select Fields to move onto the next step.
Selecting from a Business Data Connectivity source
To use data from a Business Data Connectivity source select Business Data Connectivity from the data provider dropdown menu and then click Connect. A message box will appear to let you know if the connection was successful.
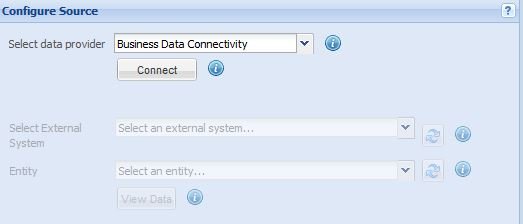
Once you have connected, specify your values for Select External System and Entity. When you have finished click View Data to see the imported information or Select Fields to move onto the next step.
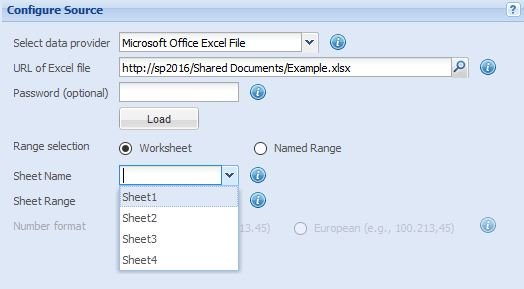
Selecting from a Microsoft Excel file
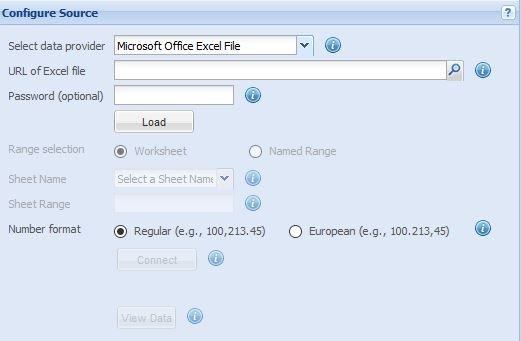
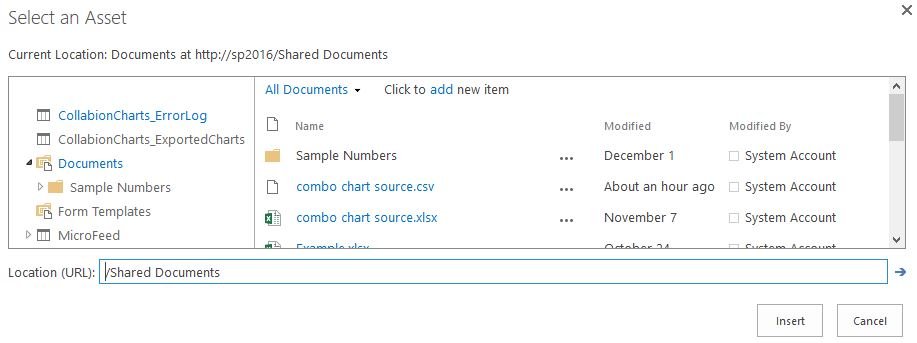
First select Microsoft Office Excel File from the data provider dropdown menu. You will have to provide the URL for the file in question, you can either enter the URL directly or use the search button to browse your SharePoint environment for the file. If browsing for the file click on the file and then click on Insert to add the URL to the file into the wizard.
Once you have the URL for the file entered, add the password if it is required and then click Load. If you have configured the settings correctly a message box should appear to tell you that the file has been loaded.
For Range selection you can choose from the radio buttons for Worksheet and Named Range If you select Worksheet you are able to choose from which sheet in the loaded Excel file the web part will draw data from using the Sheet Name dropdown menu.

Once you have selected the sheet you wish to draw data from you can then use the Sheet Range field to further refine which rows and columns from the selected sheet are used. You can use the wildcard character * as well clearly delimited values to indicate where in the sheet you wish to pull data from.
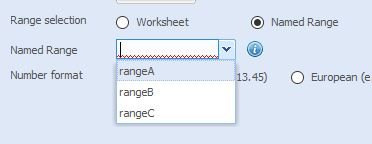
If you select the Named Range button you will be able to make use of the Excel Named Range feature and select pre-defined and -named ranges that are included in the excel file.
You can also use the Number format radio buttons to select whether the . is used as a decimal separator and , as a thousand separator, or the other way around.
When you are done click Connect and a pop-up box will tell you whether your connection was successful.
Selecting from Web Parts in the Current Page
First select Web Parts in Current Page from the data provider dropdown menu. Then click on Get Provider Parts and a pop-up box will tell you whether your connection was successful.
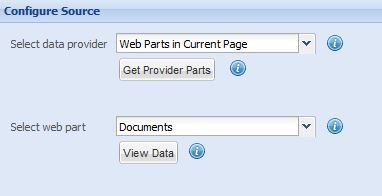
Next you can select which web part on the page you wish to draw data from using the Select web part dropdown menu. When you have selected the web part click View Data to see the collected data shown in a list.
For example, to connect to the Lightning Conductor you would first configure the Lightning Conductor to send data to the the Chart Web Part. Then, when you select Get Provider Parts you should see the following message.
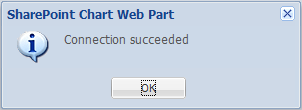
Click OK and then select the Lightning Conductor from the Select web part dropdown menu.
Selecting from an ODBC Data Source
First select ODBC Data Source from the Select data provider dropdown menu. Next enter the Connection String required for the ODBC data source.
Now click Connect and a pop-up box will inform you whether your connection was successful. Once you have connected you can enter the query that you want to use for selecting data from the source into the Query text box.
When you are finished you can view the selected data by pressing View Data.
Post your comment on this topic.