
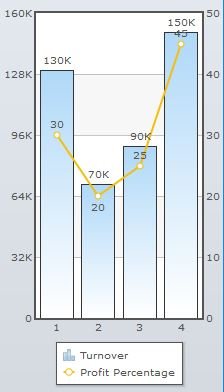
Combination Charts are also intended for use with data sets containing multiple data series. However, unlike in Multi Series charts, different data series can be plotted in different manners. For example, combining Column and Line charts into a single display as shown in the example below. This can be useful when the data series being displayed are not of similar nature, e.g. integer and percentage, and also helps viewers distinguish between the series.
The nine types of Combination Charts available in the web part are shown below.
| 2D Single Y Combination | 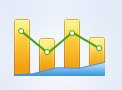 |
| 3D Single Y Combination |  |
| Column 3D + Line Single Y |  |
| 2D Dual Y Combination | 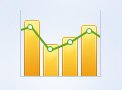 |
| Column 3D + Line Dual Y |  |
| Stacked Column 3D + Line Dual Y | 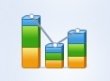 |
| 2D Stacked Column Line (Dual Y Axis) | 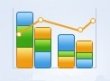 |
| 2D Stacked Column Line (Single Y Axis) | 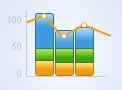 |
| 3D Stacked Column Line (Single Y Axis) | 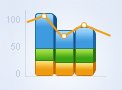 |
Feedback
Copyright © 2025 Lightning Tools
—
Powered by 
Post your comment on this topic.