
In this section of the Prepare MR form, users can access visual representations of QMS statistics. Namely, users can access data pertaining to the Audit, Quality Event, CAPA, and Training applications—all of which are based in the QMS application suite.
Filter Panel
All fields inside the search panel act as search boxes. Any value inputted inside them will be used as search criteria to filter and retrieve data from the grid, if possible.
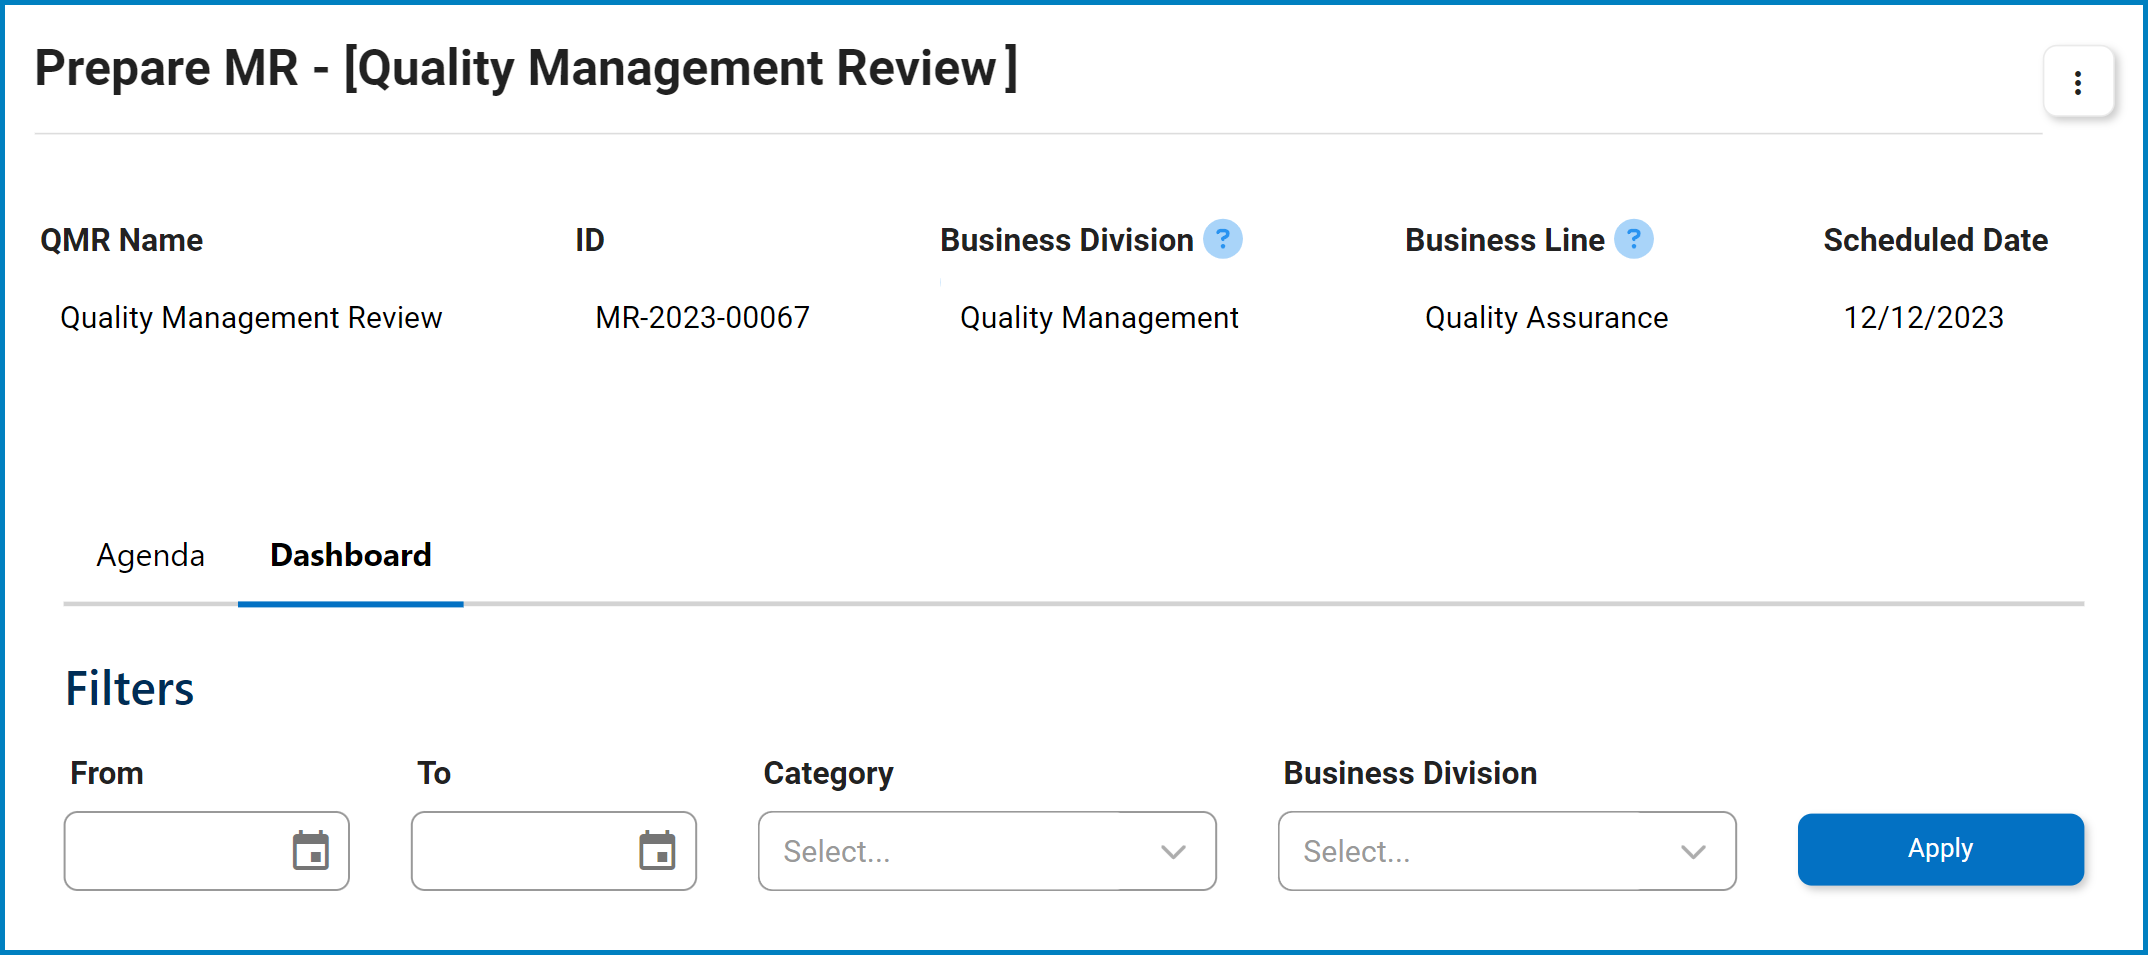
- From: This is a date picker that allows users to filter by the starting date.
- To: This is a date picker that allows users to filter by the ending date.
- Category: This is a single-select dropdown field that allows users to filter by category.
- Business Division: This is a single-select dropdown field that allows users to filter by business division.
- Apply: This button allows users to apply the selected filters to the results.
Below the filter panel, there are the following subtabs to consider:

Post your comment on this topic.