
In this tab, users can access data pertaining to the CAPA application.
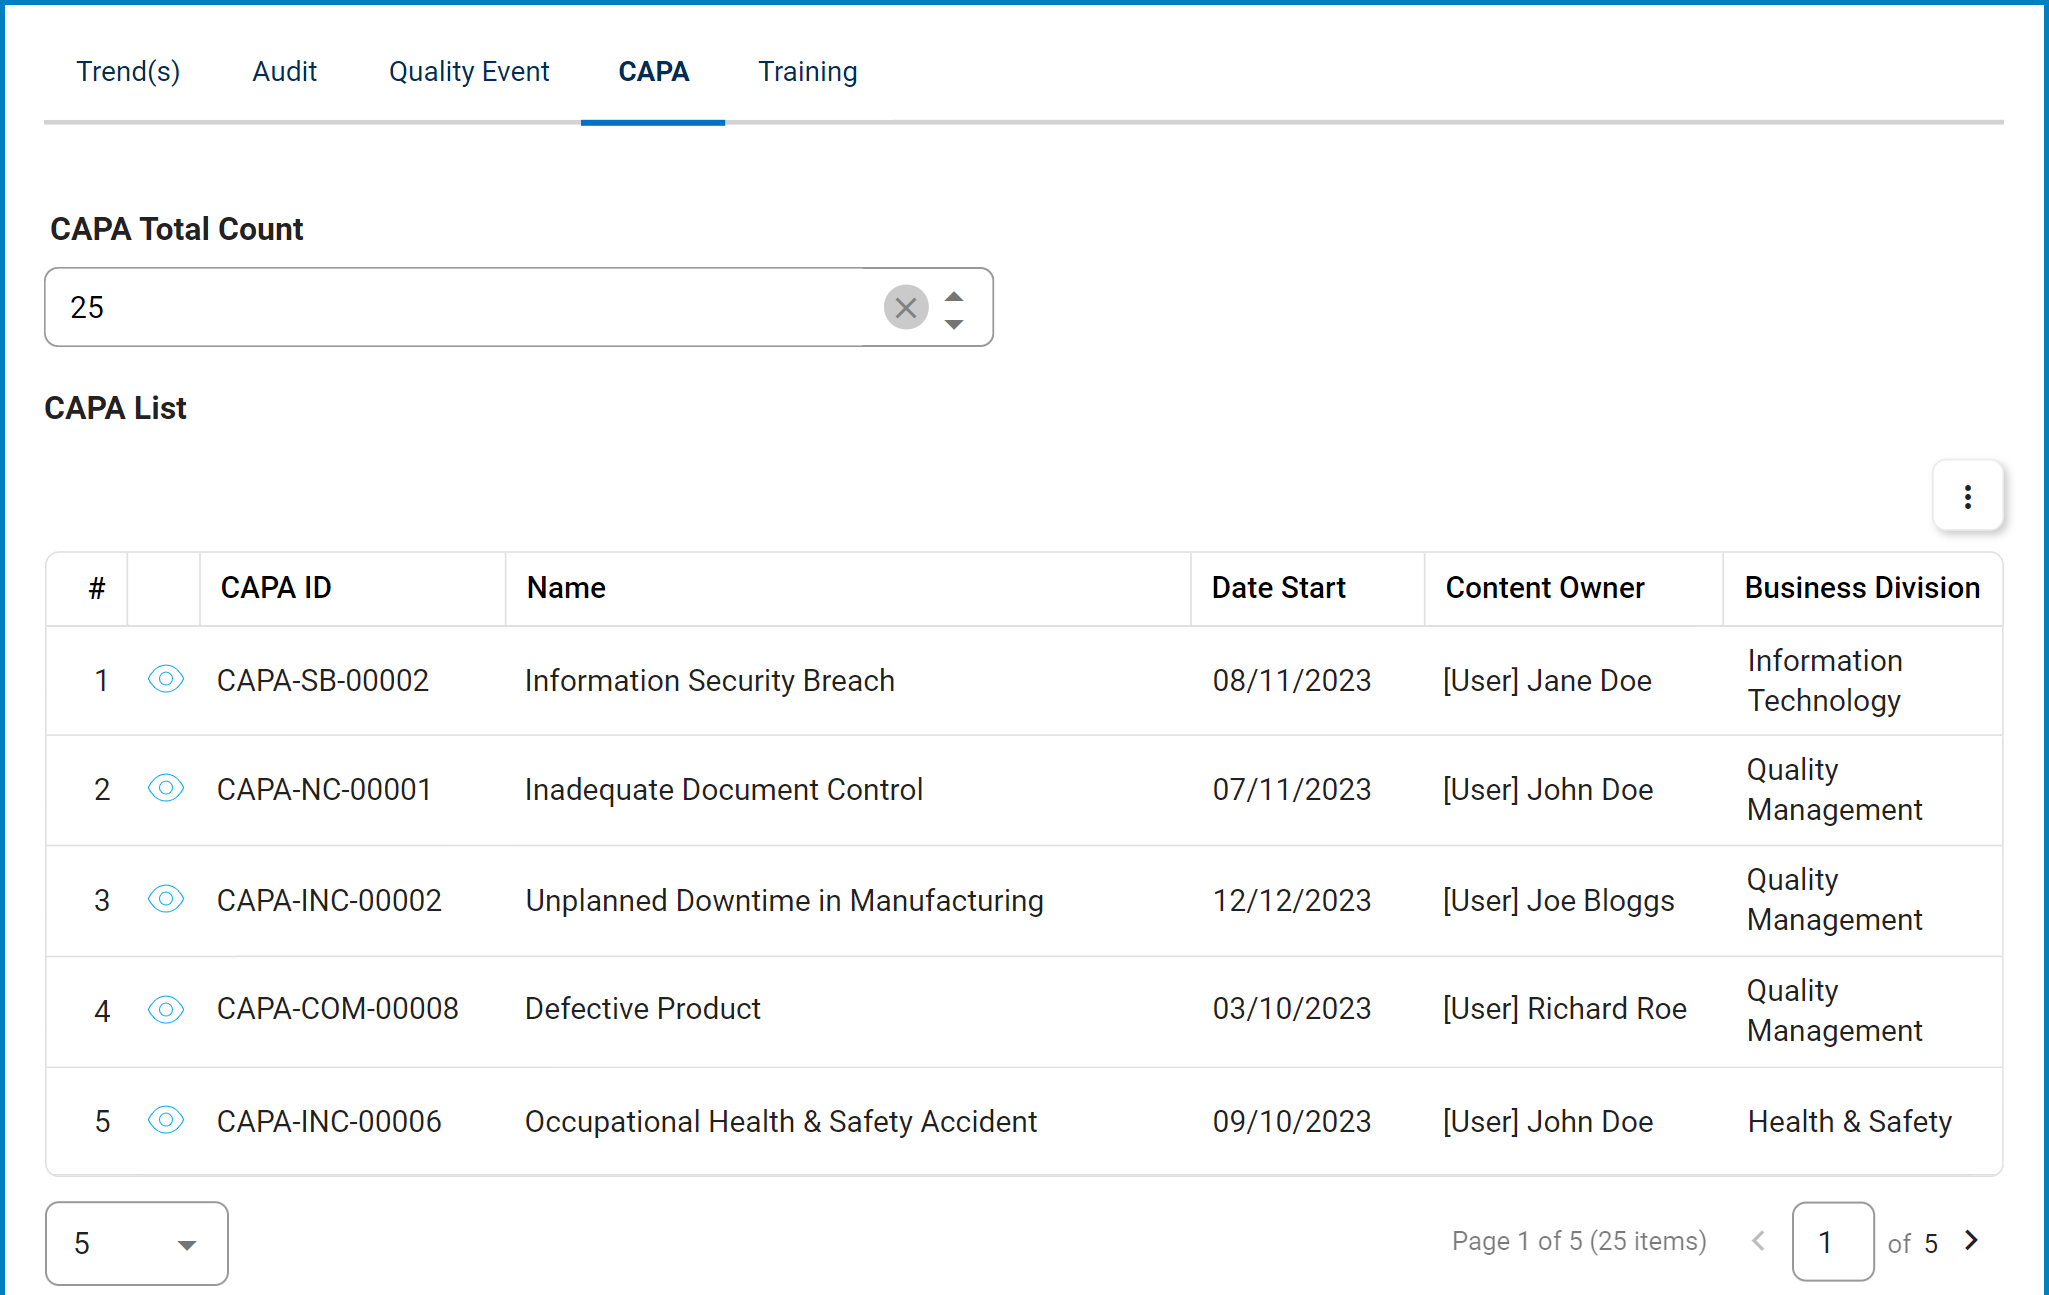
- CAPA Total Count: This is a numeric field that automatically displays the total number of CAPAs. It can be modified.
- View (
![]() ): This button allows users to view a CAPA.
): This button allows users to view a CAPA.
- In viewing mode, users cannot make any modifications. They can, however, view details in supplemental forms, download attached files, and access/download any available templates.
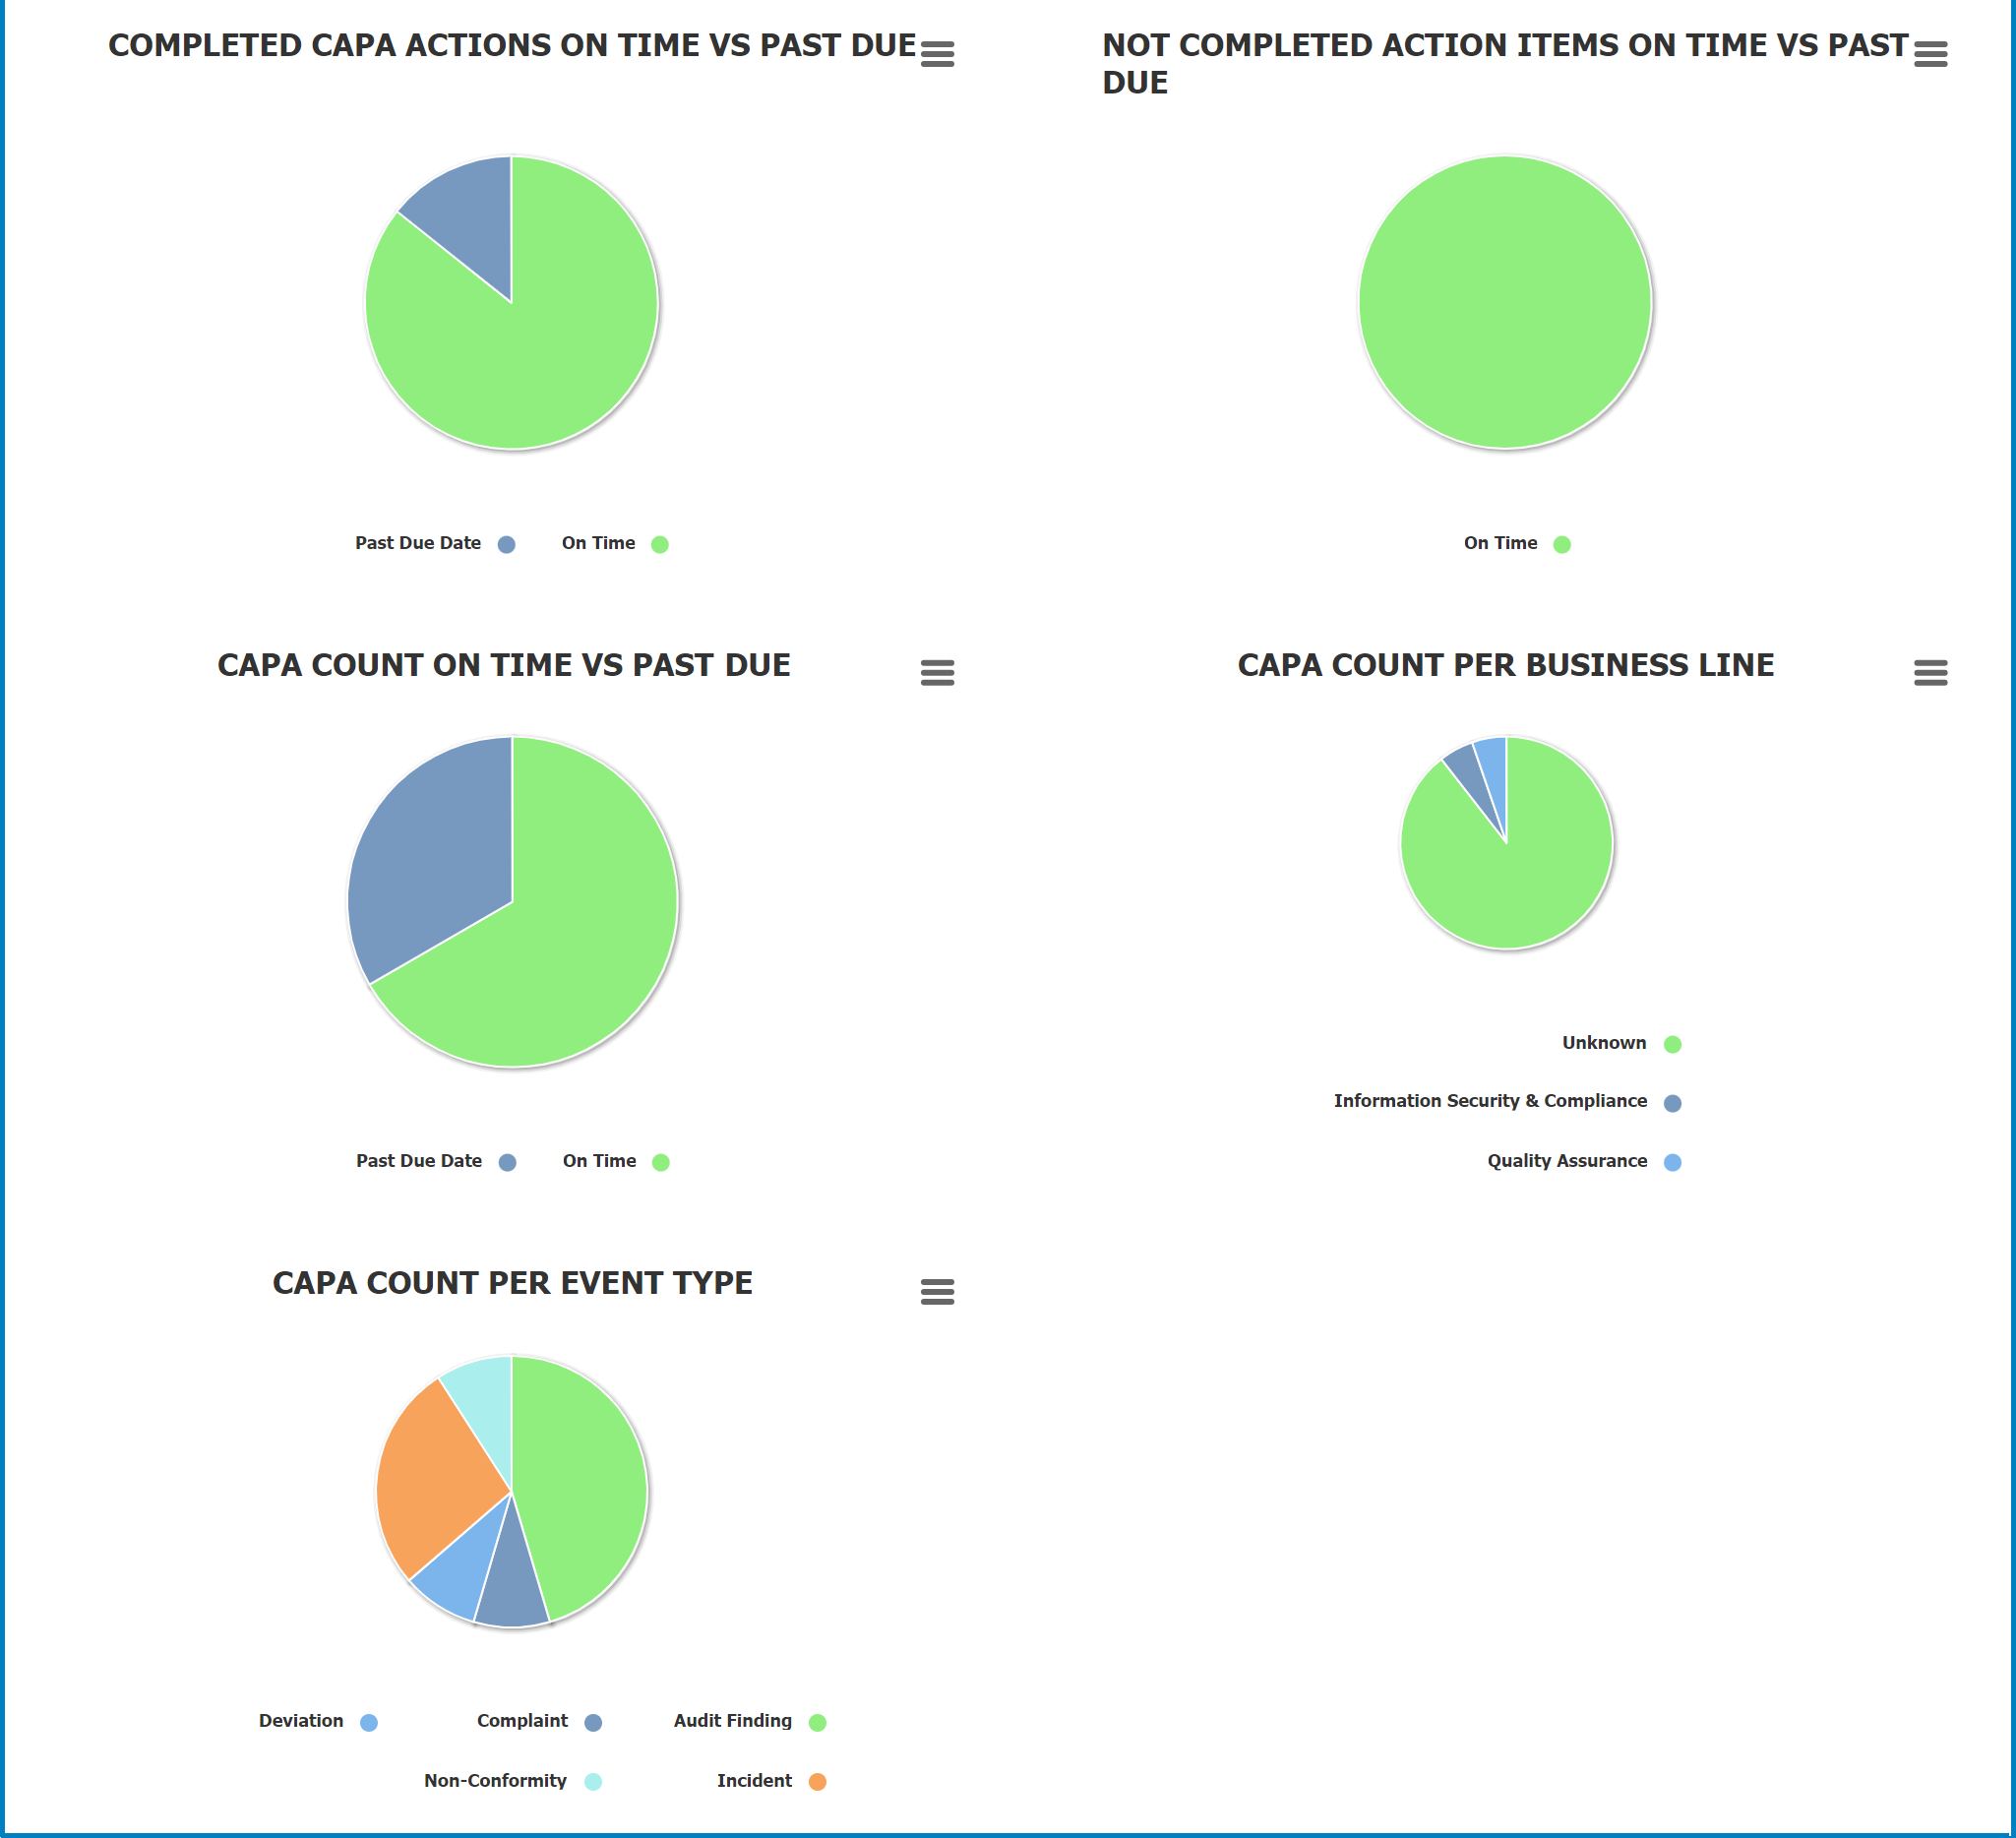
- Chart Context Menus: These are hamburger buttons which, when collapsed, display a list of options that allow users to either print or download the chart.
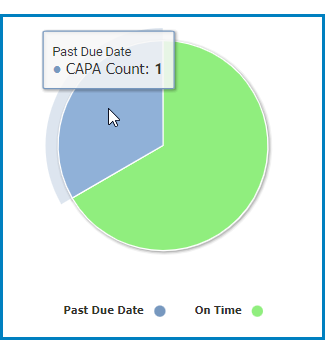
- CAPA Count: This is quantitative data that users can access by hovering their cursor over the different symbols in the pie chart. (Symbols, in this case, refers to the slices/sectors of the pie chart).
![]()
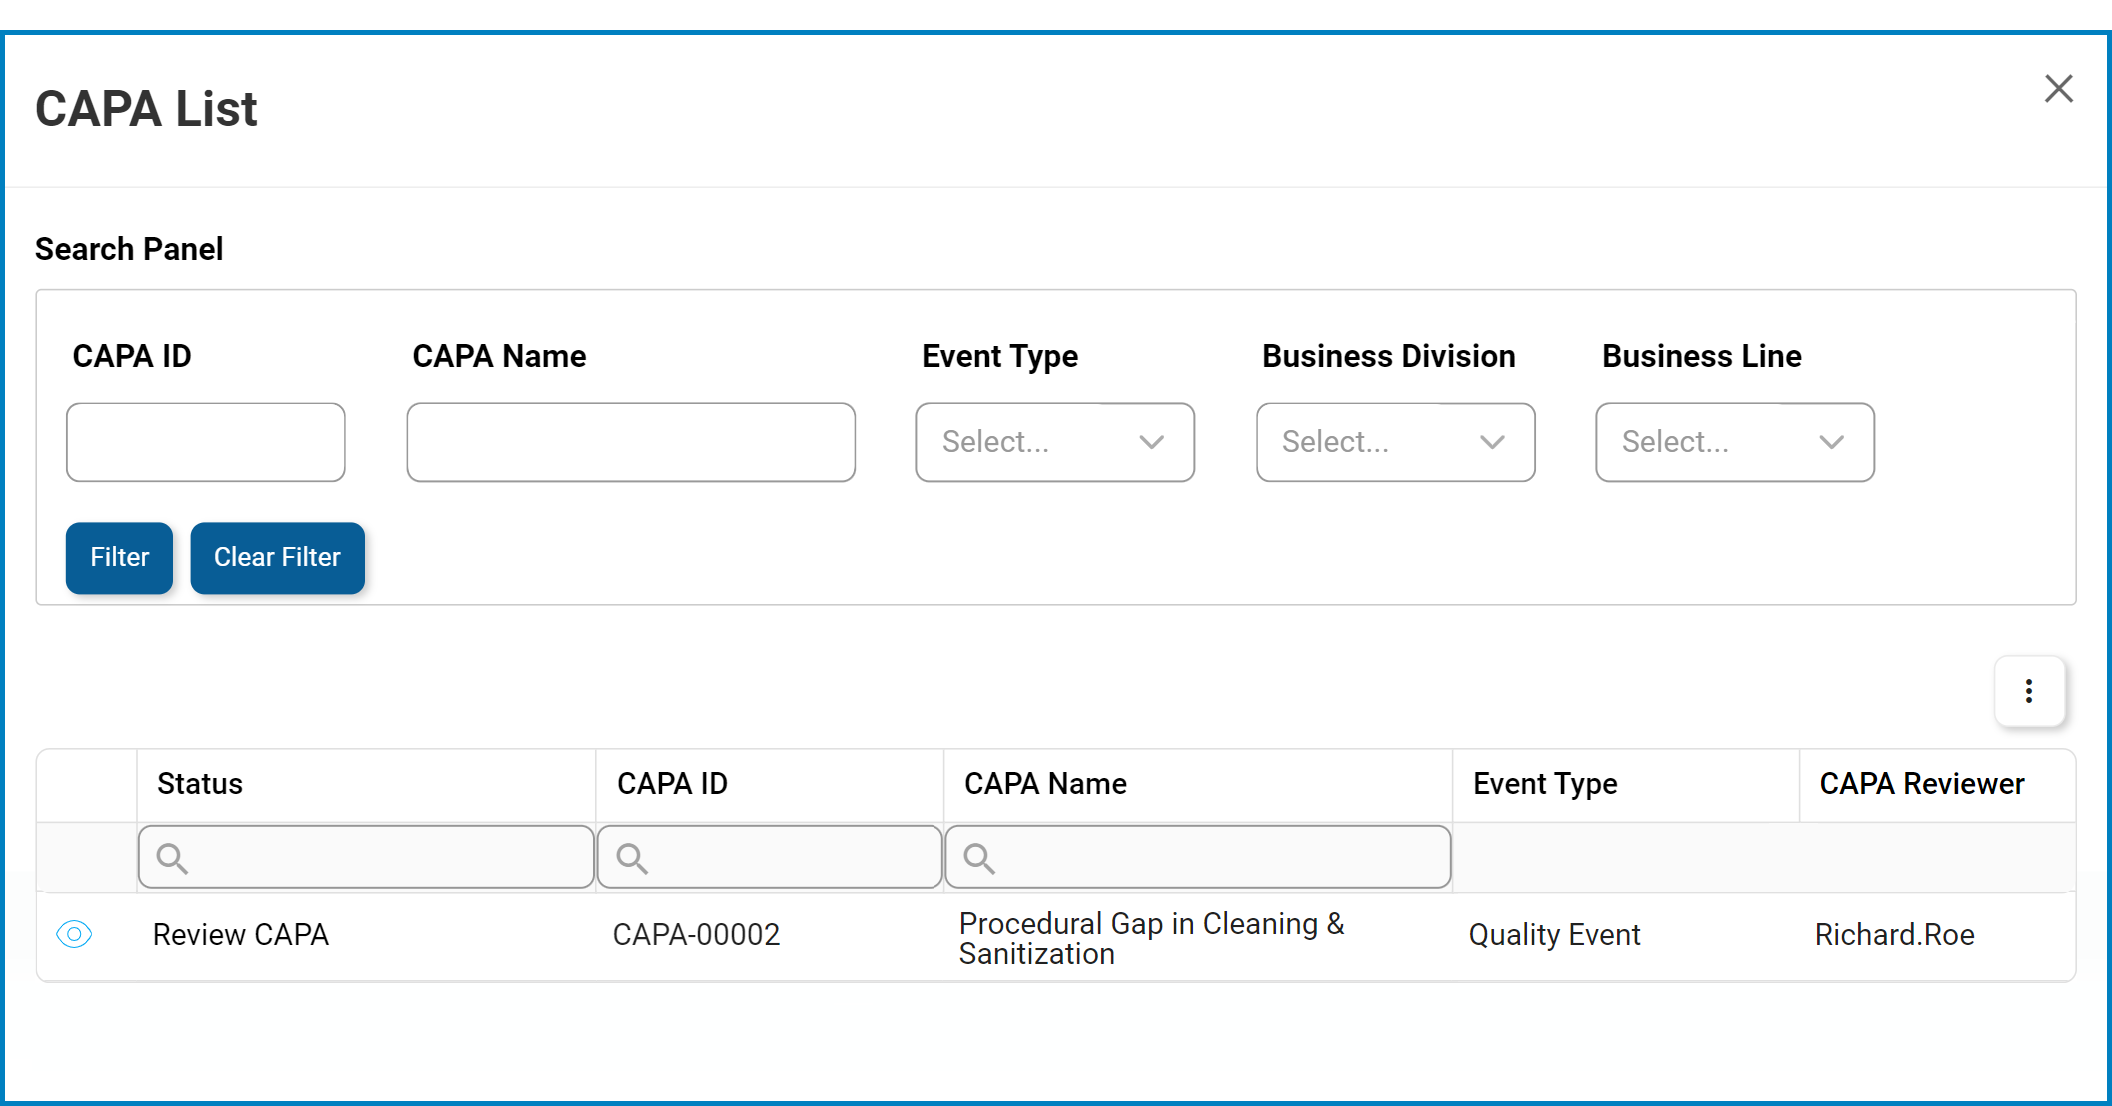
- Drilldown Reports: These are data reports that users can access by double-clicking on the different symbols in the pie chart.
- For example, if users were to double-click on the sector representing CAPAs that were completed past their due date, a pop-up window would appear with the following form:
![]()
- For example, if users were to double-click on the sector representing CAPAs that were completed past their due date, a pop-up window would appear with the following form:
*To access additional options or perform actions related to the grid, please utilize the kebab menu ( ![]() ) located in the upper rightmost corner.
) located in the upper rightmost corner.
Post your comment on this topic.