
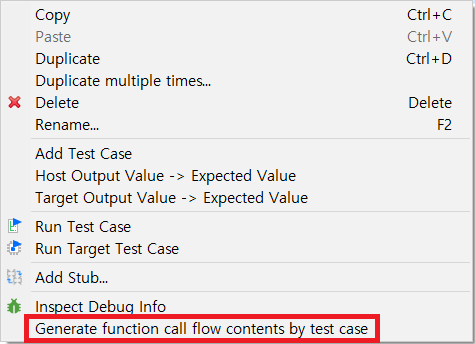
Using [Generate Function Call Flow Contents by Test case] feature, you can print the called functions sequentially when you run the test case.
- At the Unit Test View, right-click the test case and select [Generate Function Call Flow Contents by Test case].
![]()
- When [Generate Function Call Flow Contents by Test case] is executed, the [Execute Test Success] window pops up.
![]()
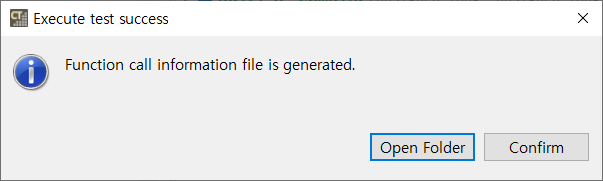
- Click the [Open Folder] button in [Execute Test Success] window. The directory containing the function call flow content file is opened.
![]()
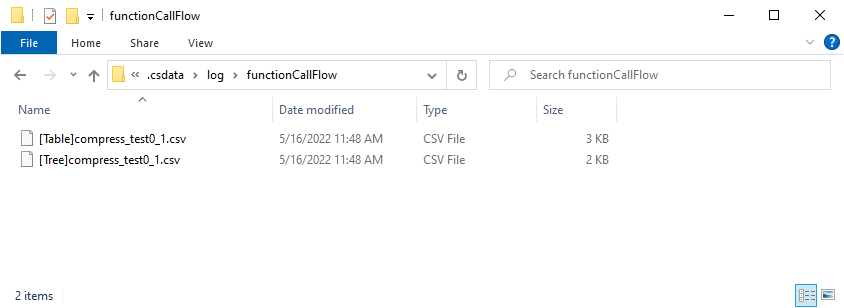
- The file includes name and parameters of the functions. There are two types in displaying function call flow.
- Table
- The calling relationship is displayed in two columns.
- The caller functions are in the first column, and the callee functions are in the second column.
- Tree
- The function call information is displayed in multiple columns depending on the call depth.
- The function call information is displayed on different lines if the call is located at different locations.
- Table
- If a function is consecutively called several times, calls are printed in an abbreviated way.
- The number of calls is indicated by appending
[called # times]after the function signature. - e.g., If the a function is consecutively called 5 times,
[called 5 times]is appended to the first function signature.
- The number of calls is indicated by appending
Example
// example code
void callee() { /*doing something*/ }
void callee2() { /*doing something*/ }
void func1() { callee(); callee2(); }
void func2() { callee(); callee(); callee(); }
void caller() { func1(); func2(); }- Table
caller-function callee-function caller() func1() func1() callee() func1() callee2() caller() func2() func2() callee() [called 3 times]
- Tree
caller() func1() callee() callee2() func2() callee() [called 3 times]
Need more help with this?
Don’t hesitate to contact us here.
Copyright © 2025 Suresofttech
—
Powered by 