
The overview provides information on coverage, coverage trends, and test result trends.
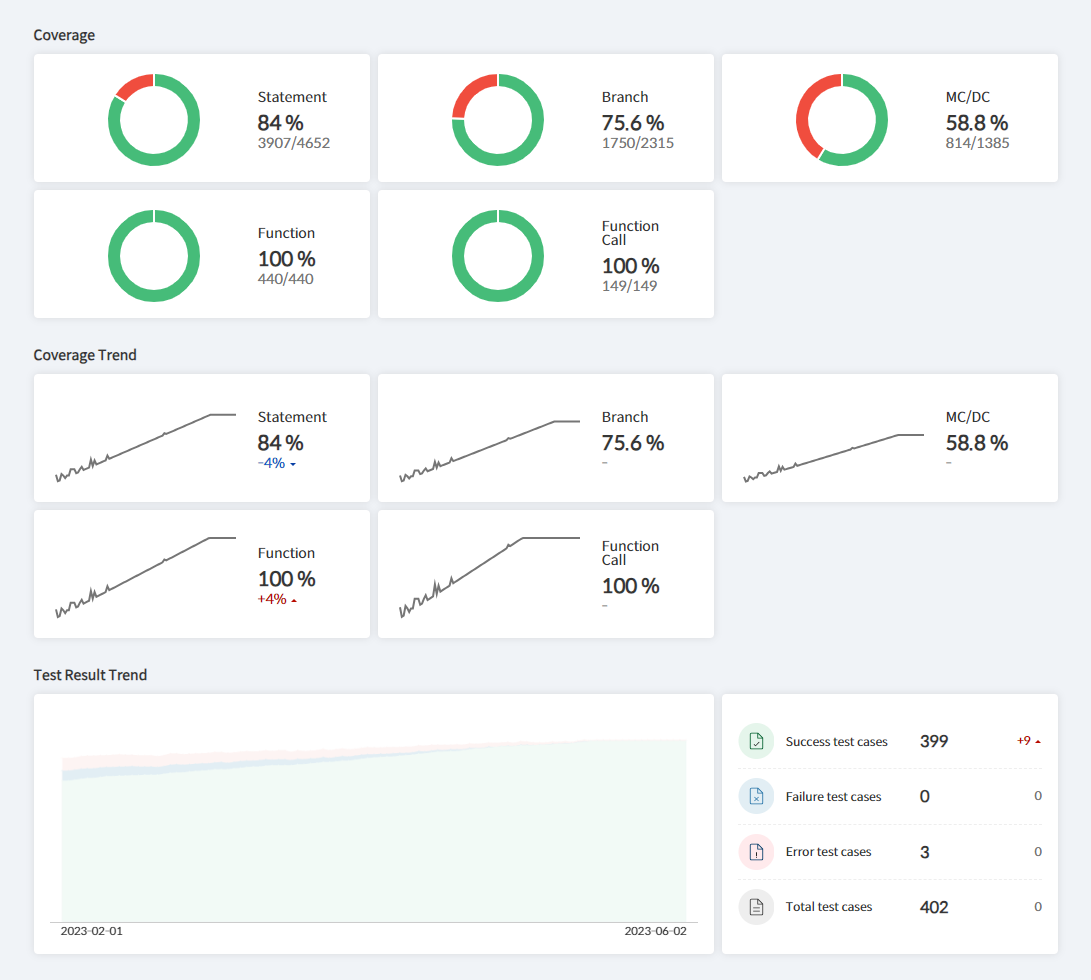
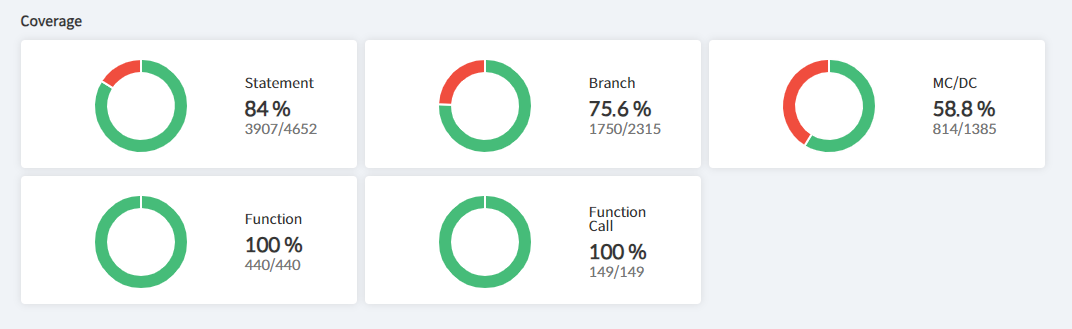
Coverage
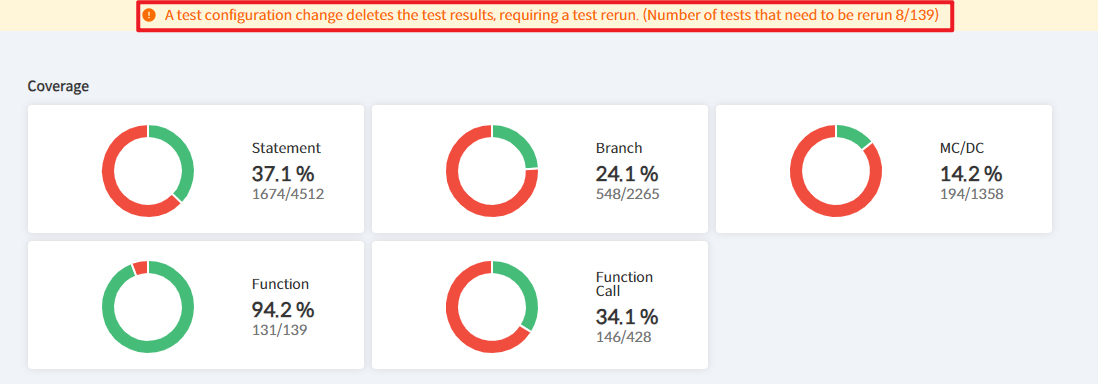
The project’s current statement, branch, MC/DC, function, and function call coverage values are displayed in percentage form. The denominator of the percentage represents total coverage, while the numerator represents achieved coverage.
Coverage Trend
Coverage trends by date are presented in the form of a graph.
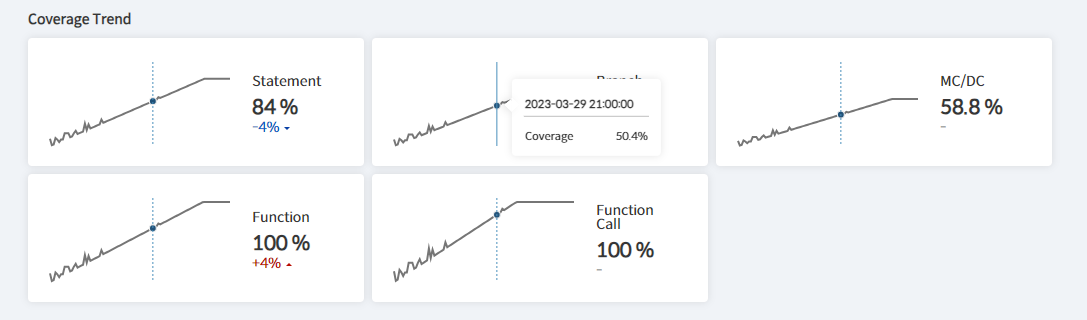
- By placing the mouse over the graph, the coverage for a specific date can be checked
- By hovering the mouse over the graph, the coverage for a specific date can be checked.
- The trend display range can be changed by adjusting the test result trend display period on the [Settings] page.
Test Result Trend
Test result trends by date are provided in the form of a graph.
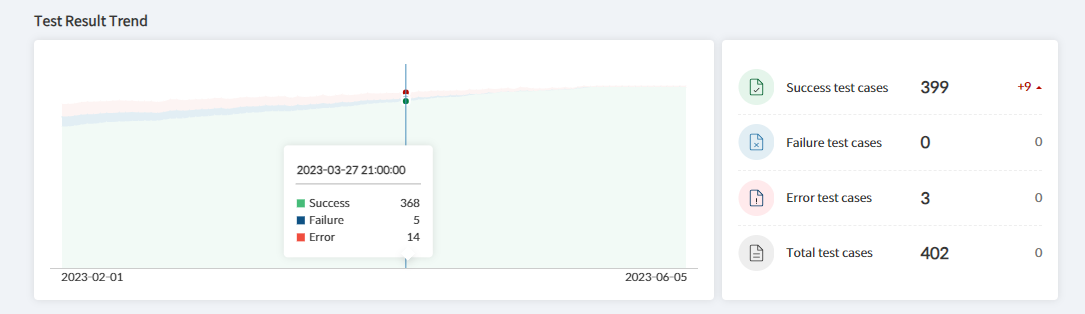
- By placing the mouse over the graph, the test results for a specific date can be checked
- On the right side of the graph, it provides the amount of change compared to the previous day.
- The trend display range can be changed by adjusting the test result trend display period on the [Settings] page.
Tests Needing Re-execution
When there are tests that require re-execution, a warning appears at the top stating, “A test configuration change deletes the test results, requiring a test rerun” By rerunning the test that was deleted the previous test results by test changes, the dashboard will display accurate coverage information. Test results are deleted in the following two cases.
- When you commit changes to a resource, the test results and coverage associated with that resource are deleted.
- When the project configuration is changed, all test results and coverage are deleted.
Need more help with this?
Don’t hesitate to contact us here.