
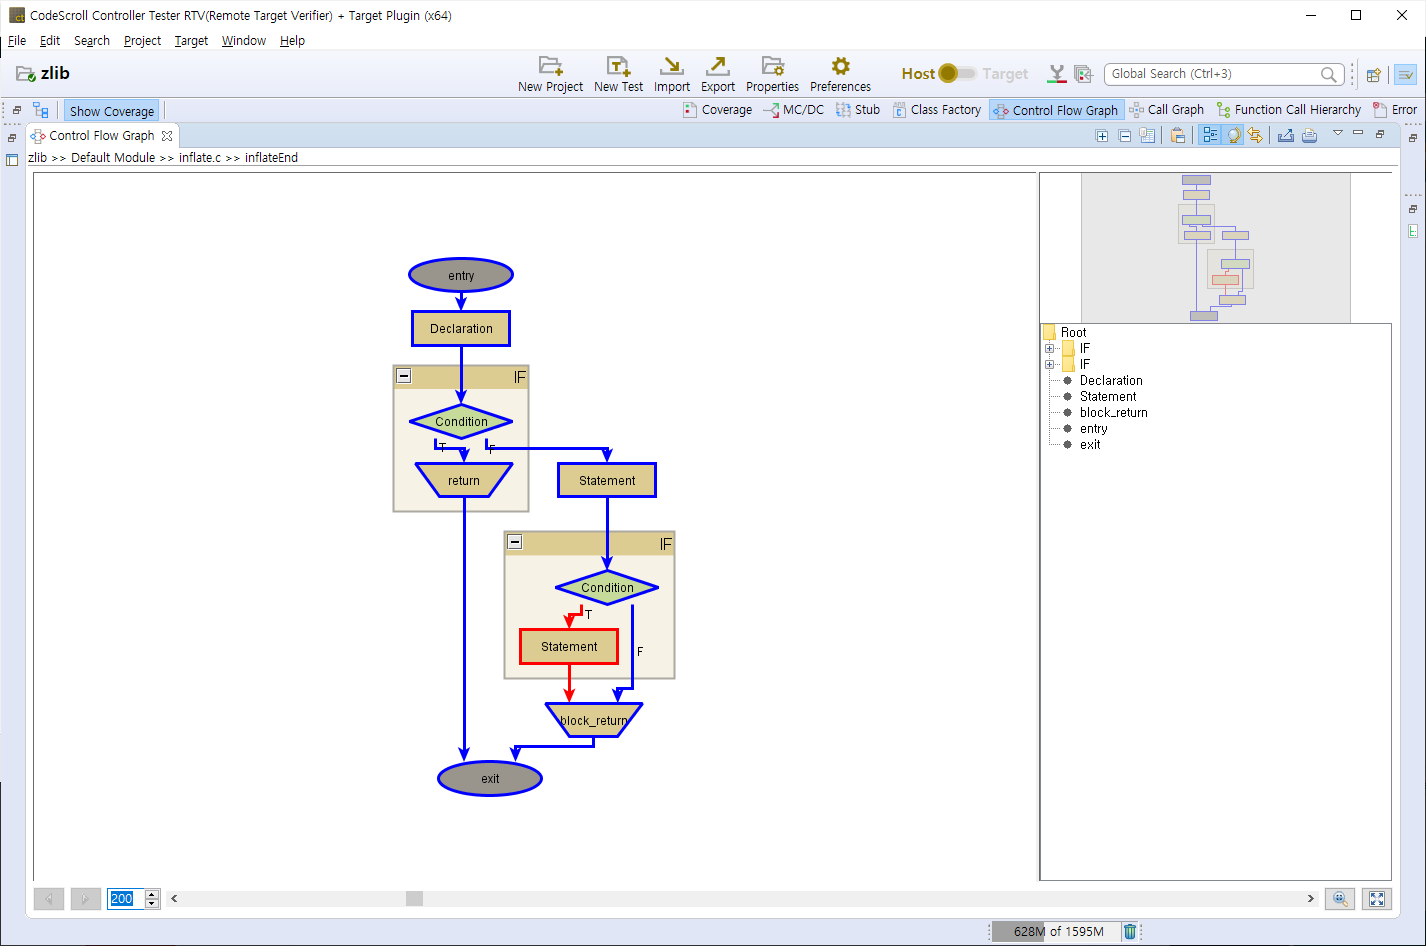
The [Control Flow Graph] view shows the control flow information for the function selected in graph format.
If you click [ ![]() Show Coverage] button in the main toolbar, the covered section is displayed in blue color and the uncovered section is displayed in red color.
Show Coverage] button in the main toolbar, the covered section is displayed in blue color and the uncovered section is displayed in red color.
Toolbar menu
| Menu | Description |
|---|---|
| |
Shows all group nodes. |
| |
Hide all group nodes. |
| |
Shows the legend(the node type in the currently displayed graph). |
| |
Copies the currently displayed graph into clipboard. |
| |
Displays the graphs in a tree format. |
| |
Shows the overview of a graph. |
| |
Shows the selected items in the graph in the editor by one-click. |
| |
Exports the contents of view in a report. |
| |
Prints the contents of view. |
Pull-down menu
| Menu | Description |
|---|---|
| |
Shows all group nodes. |
| |
Hides all group nodes. |
| Show Call Graph | Shows the function call graph for the function selected in the current view. |
| |
Shows the legend(the node type in the currently displayed graph). |
| |
Displays the graphs in a tree format. |
| |
Shows the overview of a graph. |
| |
Shows the selected items in the graph in the editor by one-click. |
| Save as Graph Format | Creates the graph model file for the graph displayed on the current screen. Four kinds of formats supported:
|
| Save as Image Format | Saves the currently displayed graph as an image format file(jpg, gif). |
| |
Copies the currently displayed graph into clipboard. |
| Preferences | Opens the preferences. |
Node Pop-up menu
| Menu | Description |
|---|---|
| Show Call Graph | Shows the function call graph for the function selected in the current view. |
History function
The node that had been selected in the current graph can be seen again by using the arrow button(Go back, Go forward) in the lower-left corner of the view.

Zoom out/in function
You can change the zoom out/in ratio by entering a number at the bottom of the view or by adjusting the slider.

You can reset the zoom out/in ratio by using ![]() [Initialize zoom out/in ratio] button at the lower right corner of the view, and change the zoom out/in ratio accordingly to the view size by using
[Initialize zoom out/in ratio] button at the lower right corner of the view, and change the zoom out/in ratio accordingly to the view size by using ![]() [Fit to view size] button.
[Fit to view size] button.
Need more help with this?
Don’t hesitate to contact us here.