
Distribution by days and chart interval selection
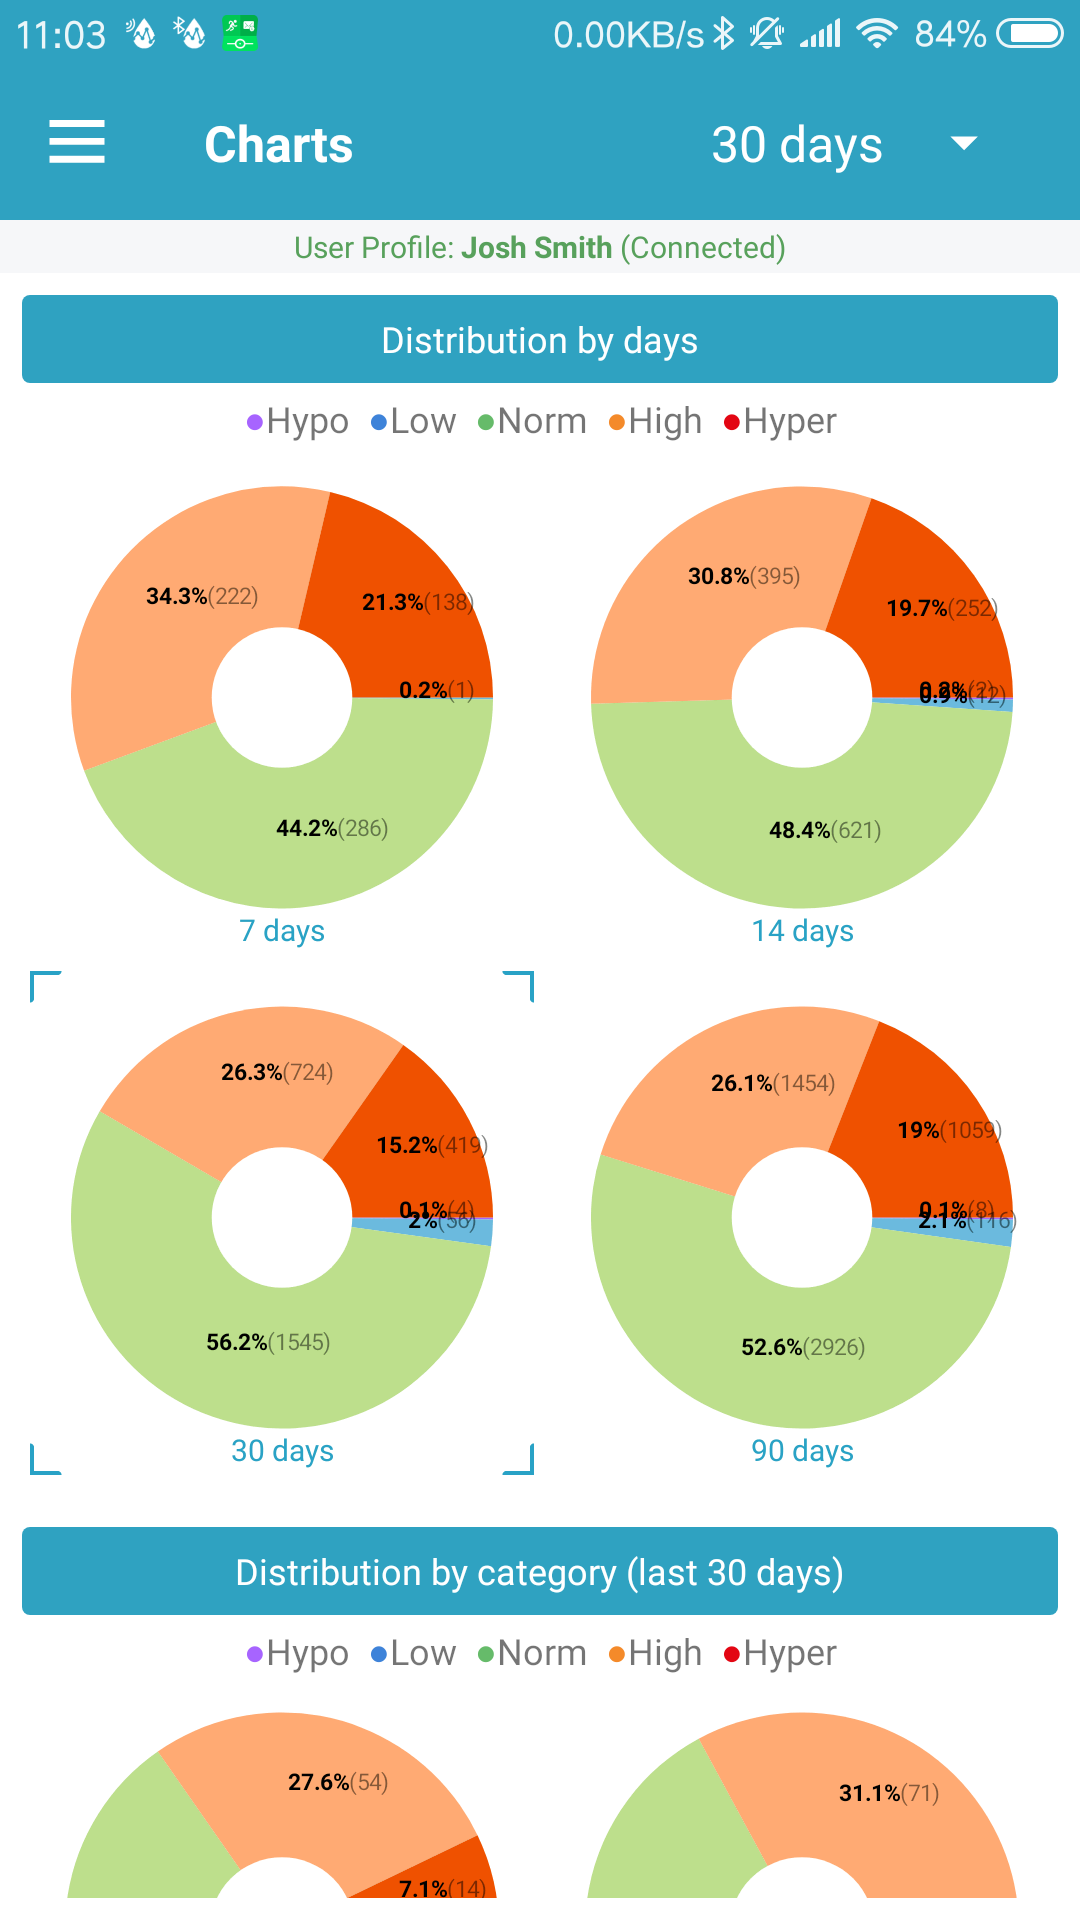
These pie charts show your blood glucose distribution according the target limits you entered in the settings.
You can select the time interval for the other charts as tapping on the corresponding pie chart. Its border will be highlighted.
They are useful because you can see easily what your glucose levels averages were in the last 7/14/30/90 days and check how you were doing in the near past.
Distribution by category for the selected interval
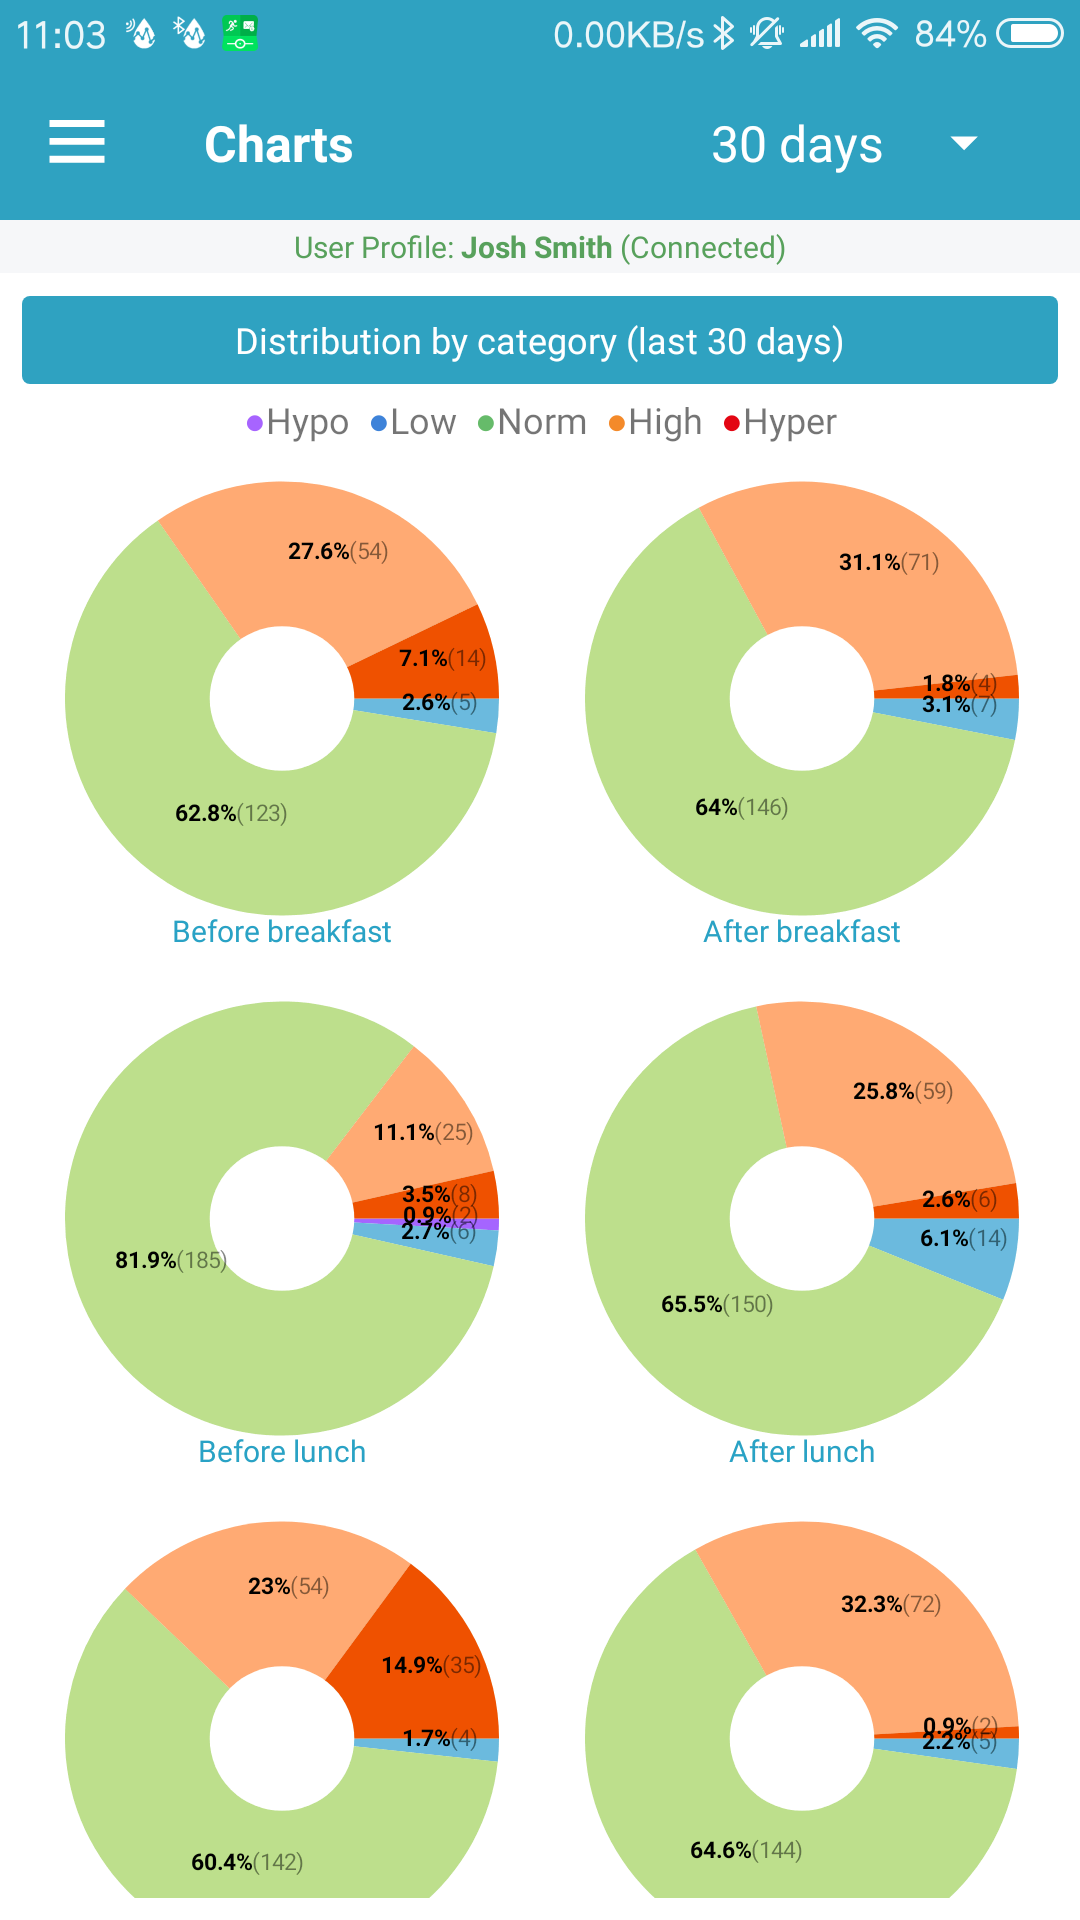
These pie charts show your blood glucose distribution per time category as night, before meal, after meal or other if the reading appears in other time.
In those charts you can find if you have problems in some time of the day, for example if your glucose before bed was usually higher than it needs to be or you’re not measuring your glucose enough in some time of the day.
Such strange things about your glucose measurements can be seen easily on those charts.
Time categories are:
- “Night” – between 21:00 to 07:00 in the morning
- “Before” meal – 1 hour before the meal
- “After” meal – 2 hours after the meal
- “Other” – all other hours and categories as “Snack” and “Fasting Glucose”
Meal hours as breakfast, lunch and dinner are specified in the Settings screen.
Haben Sie noch weitere Fragen?
Kontaktieren Sie uns.