
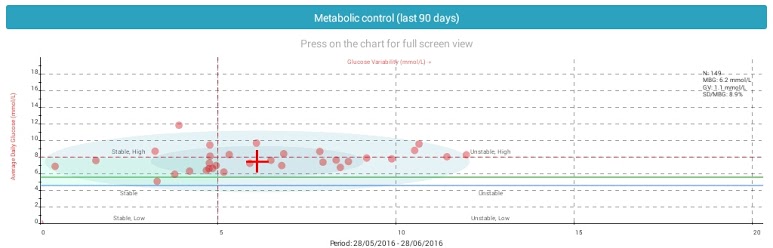
Metabolic control
This chart shows the glucose variability and average daily glucose. It tells you if your glucose is varying too much and if your daily glucose levels are normal. In the best scenario most of the dots (readings) should be in the inner circle.
If most of the readings are in the inner circle it means that your glucose was stable and didn’t vary too much.
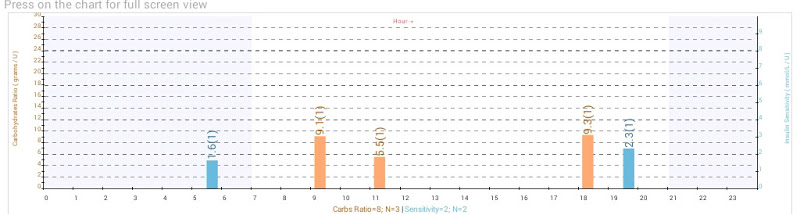
Insulin Sensitivity/Carbohydrate Ratio
This chart shows calculated carbohydrate ratio and insulin sensitivity based by the information during the selected interval. Diabetes:M tries to identify patterns in the data you entered with which it can calculate some insulin sensitivity and carbohydrates ratio. If you have enough correct data available, those calculated values after the analysis should almost match your real insulin sensitivity and carbohydrates ratio values.
Description
- Insulin sensitivity bar (blue)
- Carbohydrate ratio bar (orange)
- Average value calculated for the hour (over the bars)
- Count of the successful calculations for the hour. The hour average is calculated using these values (in the brackets)
In the chart description at the bottom of the chart you can see the total averages for these values based by all successful calculations.
Calculation basics
To calculate carbohydrate ratio successfully there must be a glucose reading, insulin dose and carbohydrate entry and there must be at least one glucose reading during the second, third or fourth hour after the first reading.
To calculate insulin sensitivity successfully there must be a glucose reading below or above the target and insulin dose entry but NOT a carbohydrate entry. There must be at least one glucose reading during the third, fourth or fifth hour after the first reading.
Haben Sie noch weitere Fragen?
Kontaktieren Sie uns.