
Statistics
Diabetes:M provides a lot of statistics in form of diagrams, graphs and charts. You can view your collected data visually and understand it better.
Main statistics
On the home screen there is a field called “Statistics”, it takes you to this screen which shows you some personal stats and the statistics for the last 7/14/30/90 days.
The summary sections displays the most important statistics which are calculated using the user’s settings and the data in the entries database.
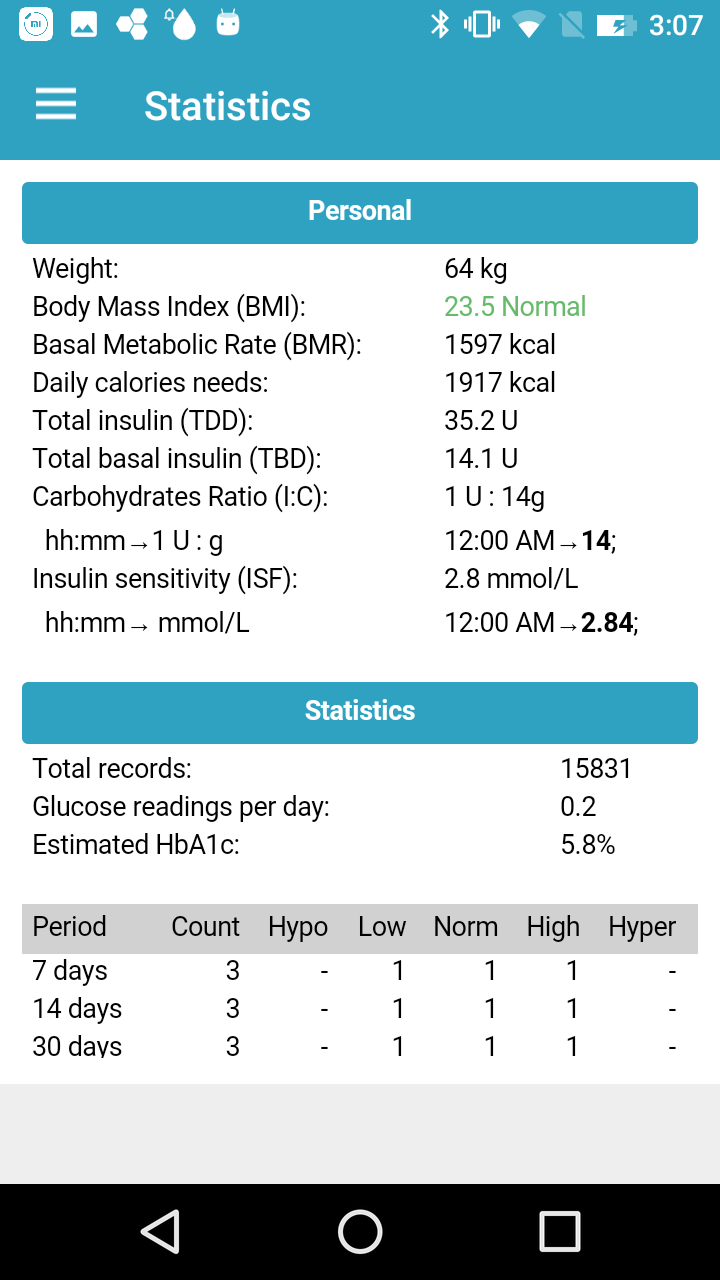
Personal
Weight
*Body Mass Index (BMI) * – based by your weight and height this index indicates whether your measures are in normal limits or you are underweight or overweight
Basal Metabolic Rate (BMR) – BMR represents the number of calories you need to maintain your weight if you are sedentary. It is based by your weight, height, age and sex.
Daily Calorie Needs – usualy you need morе calories per day than your BMR index. Daily Calorie Needs is based by your BMR and your daily activity.
Total Insulin – the total daily amount of insulin based by the body weight and bolus insulin type (rapid or regular)
Total Basal Insulin
*Carbohydrate Ratio * – represents how many grams of carbohydrates are covered by 1 unit of insulin. Based by body weight and bolus insulin type (rapid or regular)
Insulin Sensitivity – represents how much the blood glucose will be lowered when apply 1 unit of insulin. Based by body weight and bolus insulin type (rapid or regular)
Period average statistics
Main statistics
Total records – total records count in the database
Average glucose readings per day – displays how many records with blood glucose value are entered in the database
Estimated HbA1c – HbA1c value based by the blood glucose readings for the last 90 days. Requires minimum of 9 glucose readings to calculate the estimation of HbA1c value.
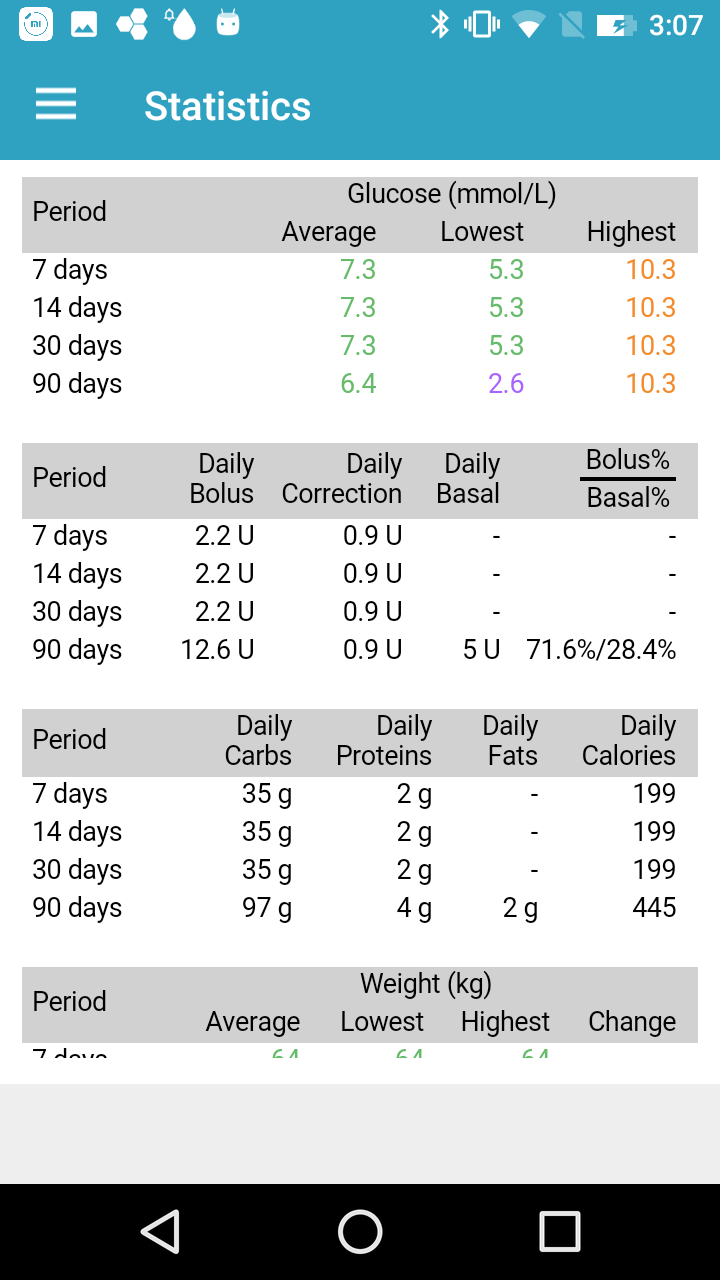

Table with the glucose reading counts for the current day and the last 7, 14, 30 and 90 days grouped by hypoglycemia, low, normal, high and hyperglycemia blood glucose values.
Table with the averages for glucose readings for the current day and the last 7, 14, 30 and 90 days. Also displays the lowest and highest value for the time period.
Table with carbohydrates and insulin daily totals for the current day and the last 7, 14, 30 and 90 days. Also displays the ratio between bolus and basal insulin daily intake.
Table with weightfor the current day and the last 7, 14, 30 and 90 days and the change between
Table with sleep and activity data – if you have enabled the “Smart assistant”
Table with the LBGI and HBGI risk indexes and glucose variability indicator. For details see Blood Glucose Indexes.
Other statistics
Diabetes:M provides a few types of data visualizations showing different variables from your data:
Graph – showing glucose levels and glucose infusion rate throughout the day with options to filter the data
Charts – display all the collected data in various types of reports with time configuration
Reports – prepare reports for some period, export it as XLS, HTML, PDF and save it or share it with your doctor.
Haben Sie noch weitere Fragen?
Kontaktieren Sie uns.