
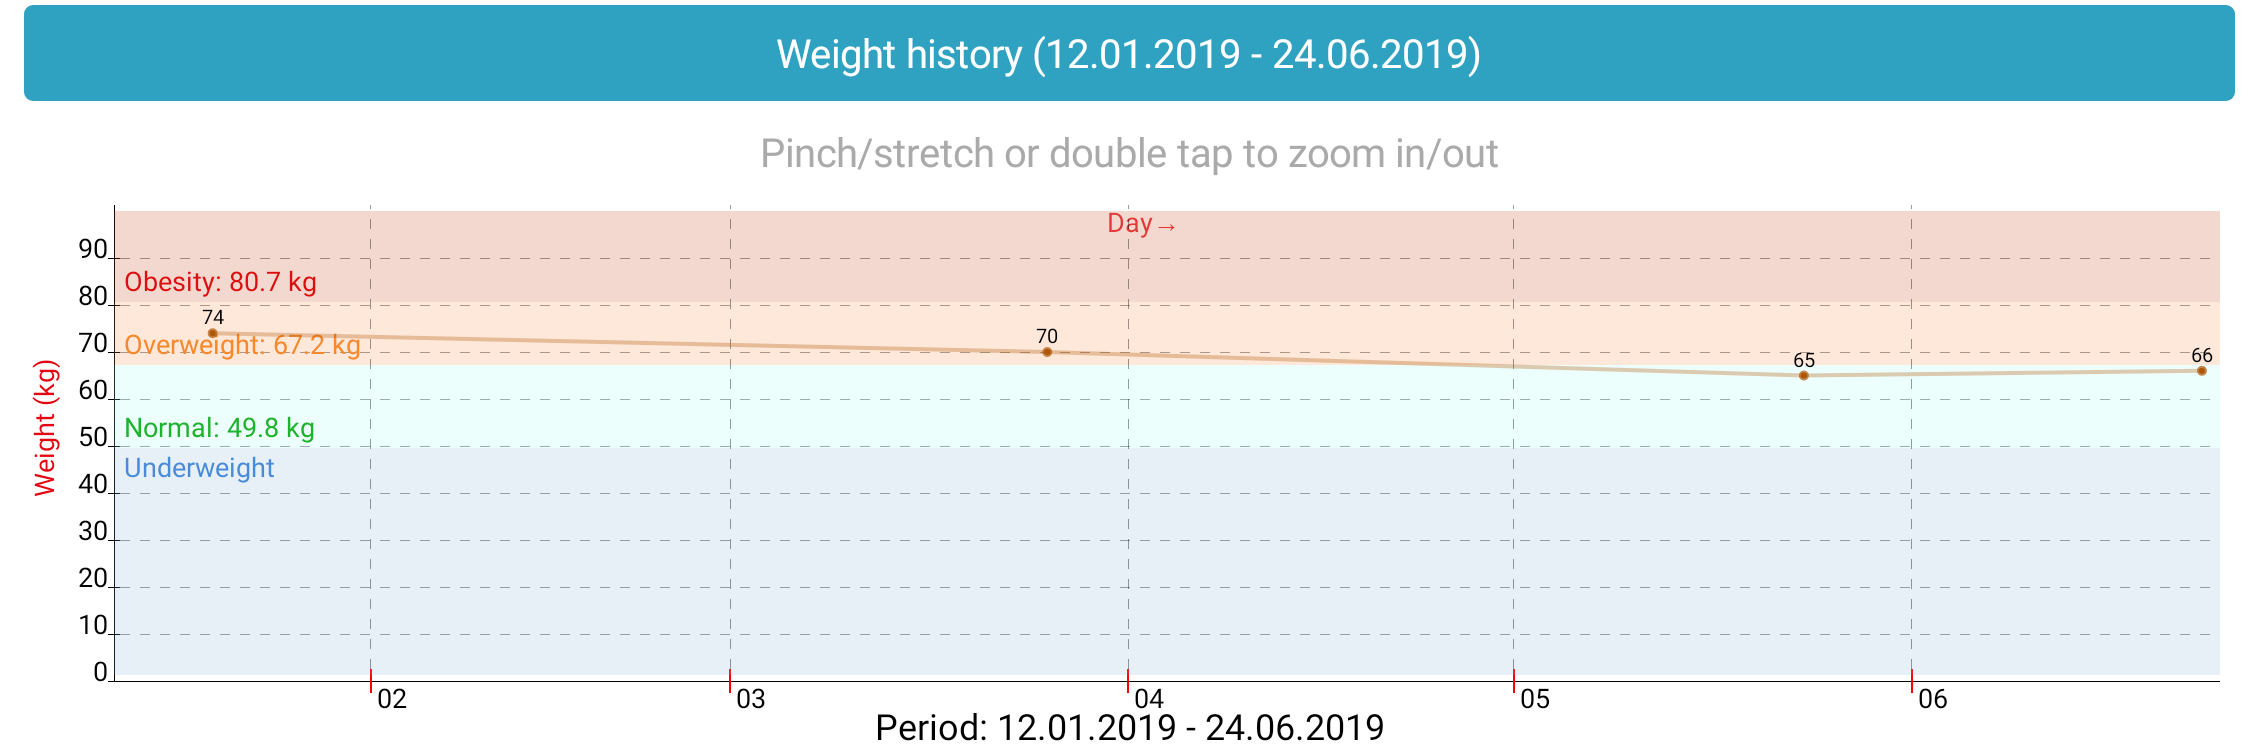
Weight history
This chart shows the history of all the weight recordings for the selected interval.
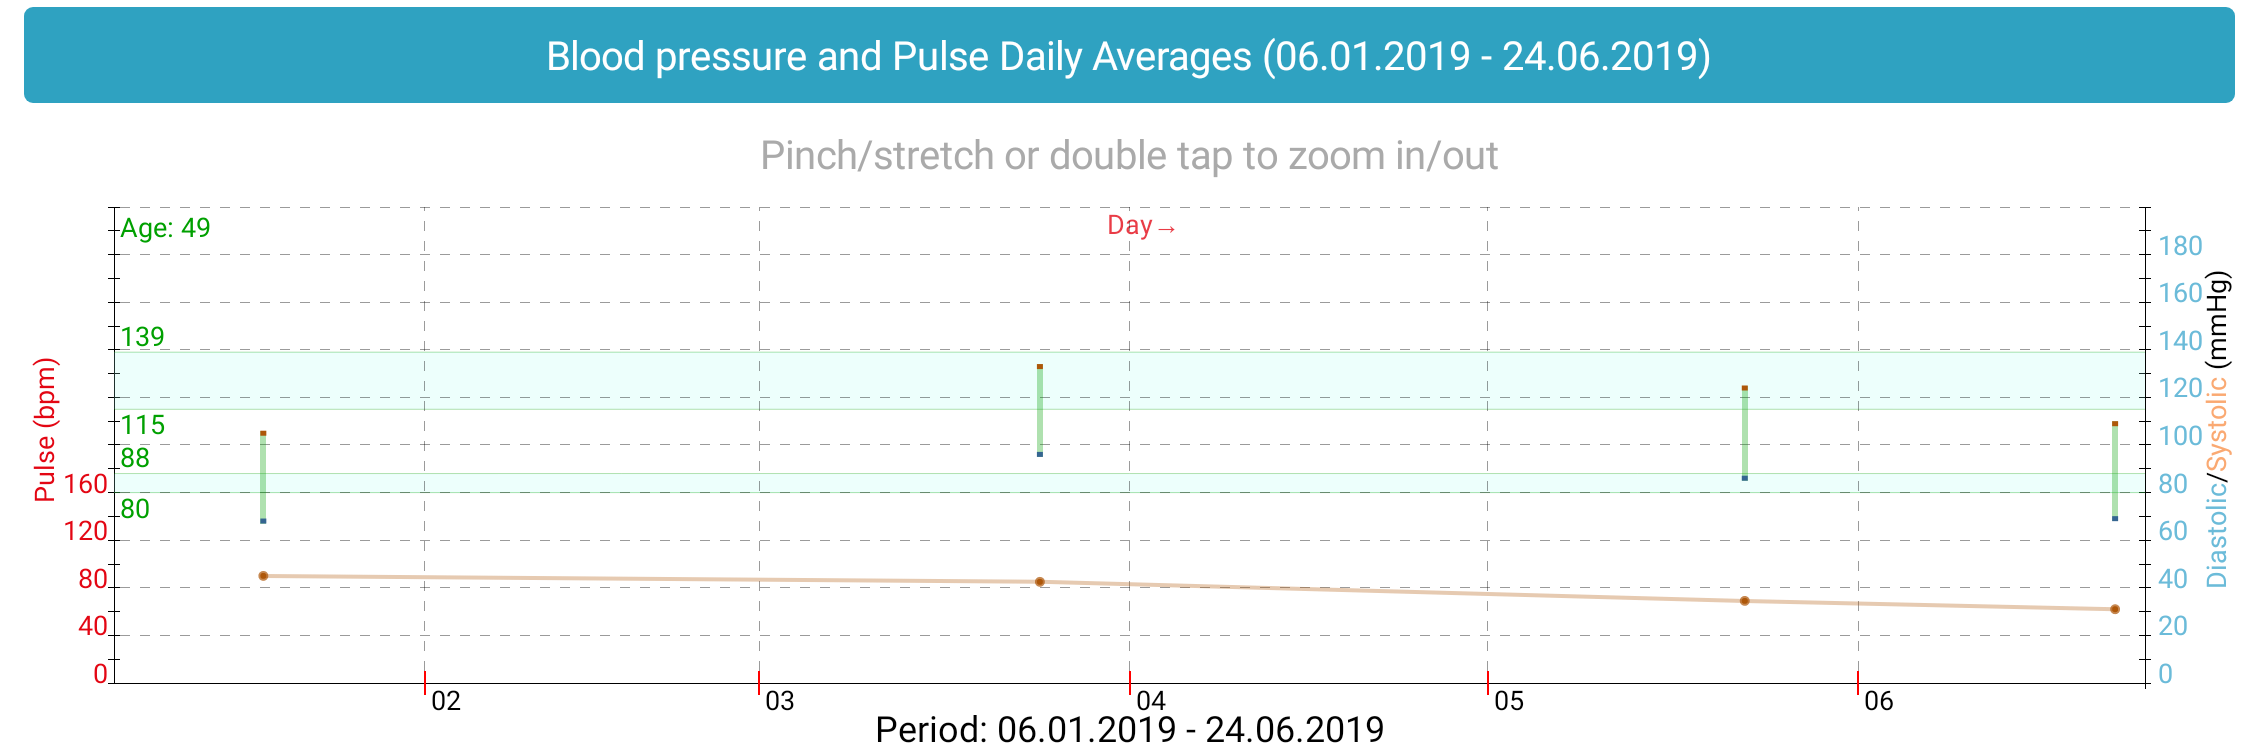
Blood Pressure & Pulse history
This chart shows the history of all the blood pressure and pulse recordings for the selected interval.
The target zones are calculated depending by the age. When pulse pressure is above or below the safe range the bar is in red.
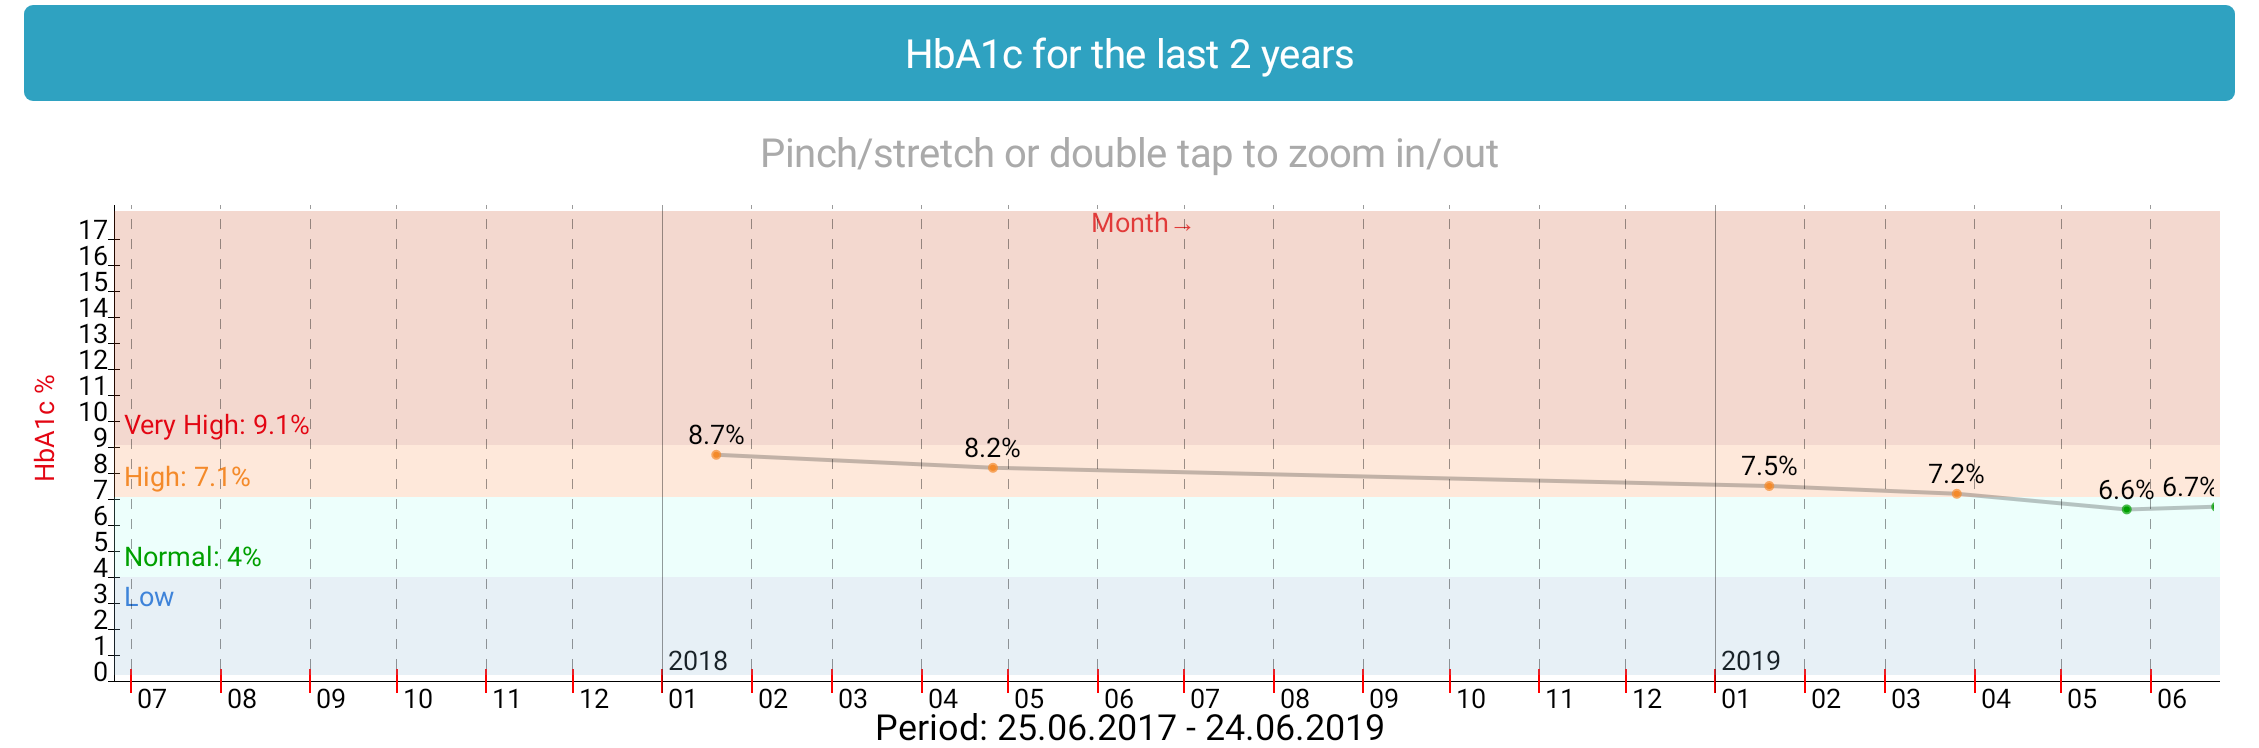
HbA1c history for the last 2 years
This chart shows the history of all the HbA1c recordings for the last 2 years.
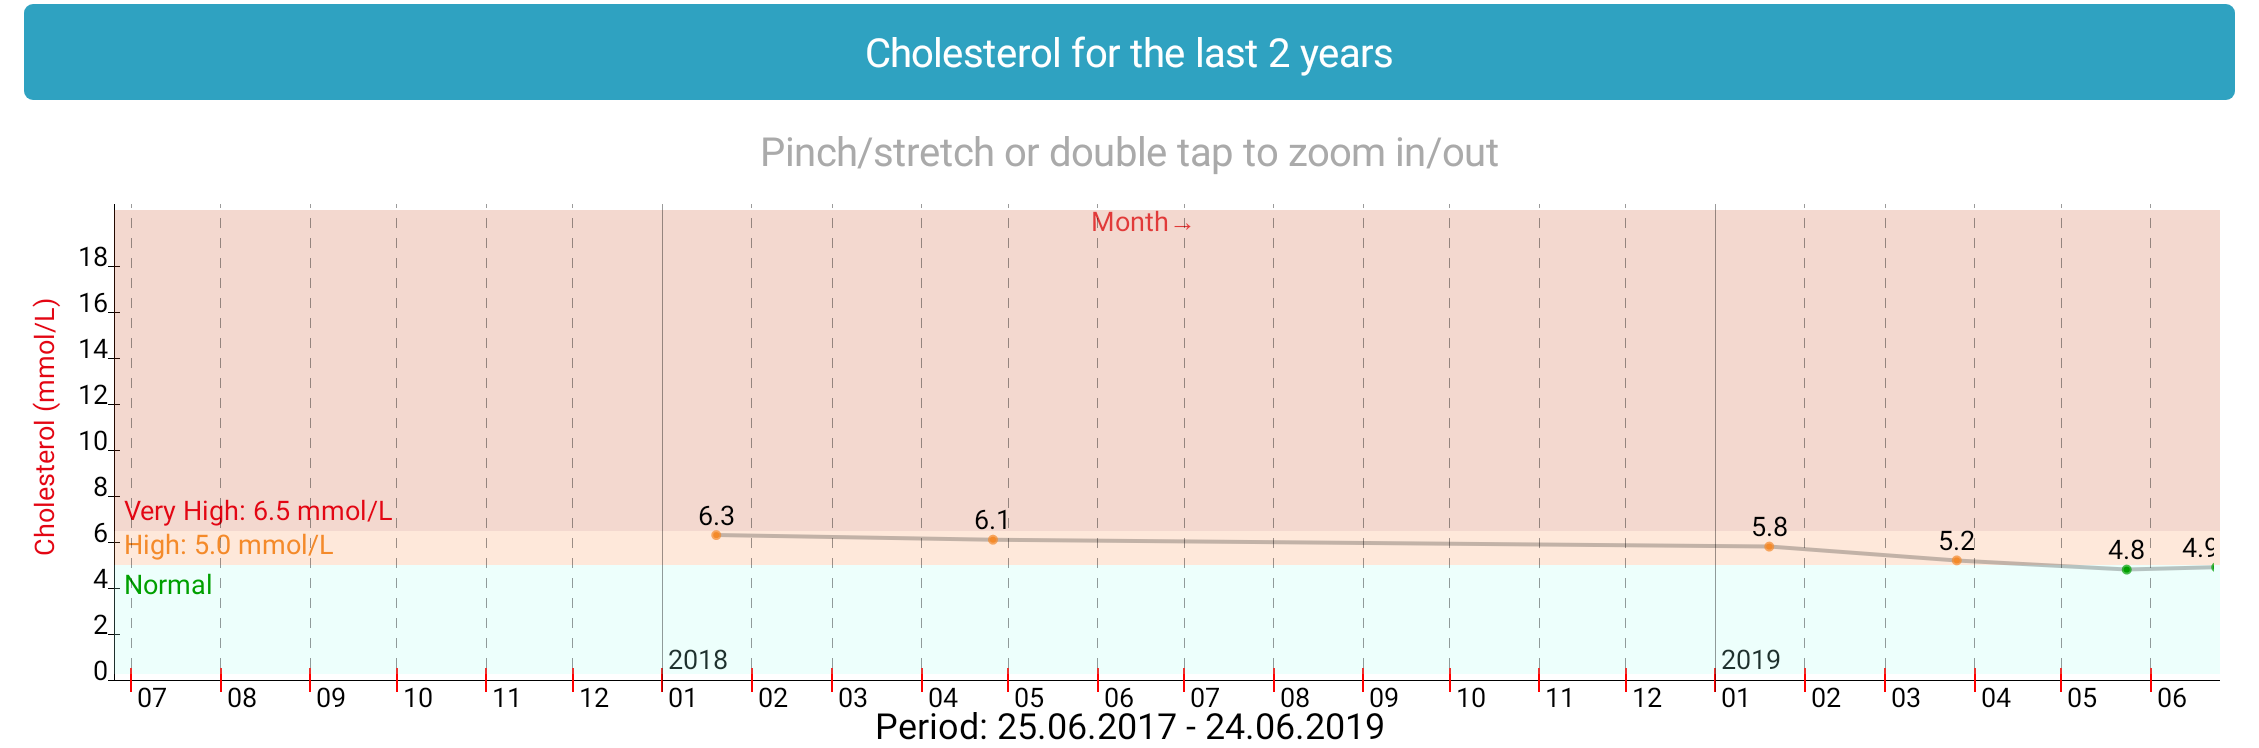
Cholesterol history for the last 2 years
This chart shows the history of all cholesterol recordings for the last 2 years.
Haben Sie noch weitere Fragen?
Kontaktieren Sie uns.