
We have added a new module to the QMS Dashboard application—the Actions Items Dashboard. This module provides a centralized hub for users to access visual representations of action item metrics.
Key Features:
- Action Item Monitoring
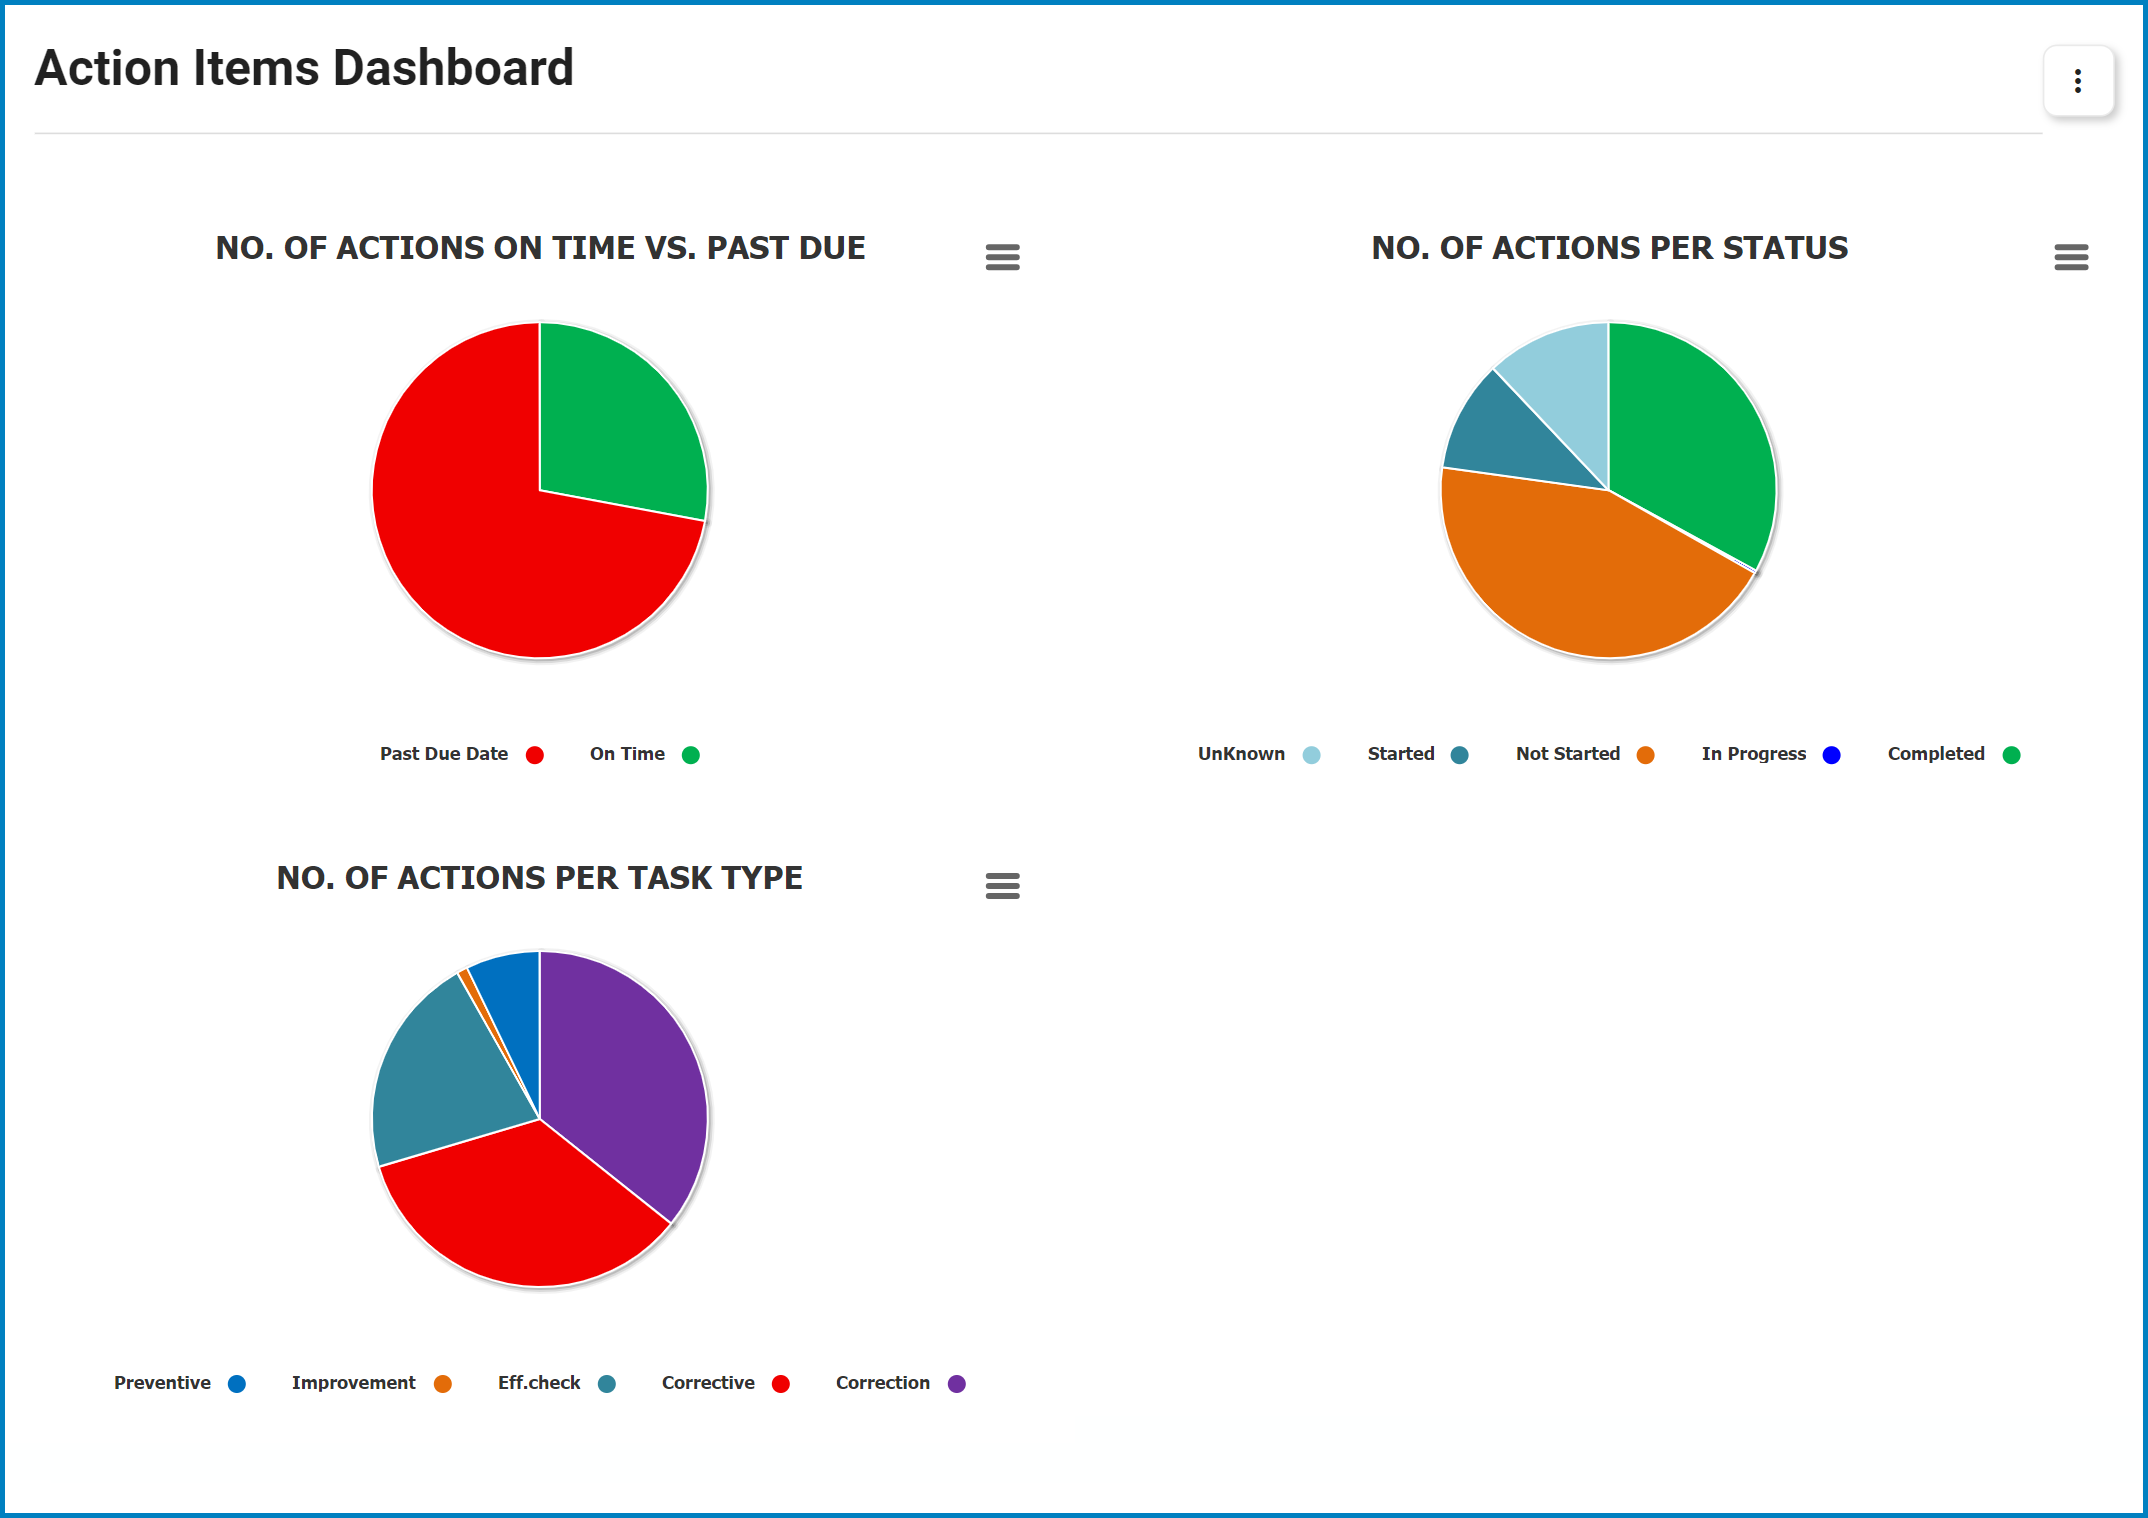
Users can monitor action items through three essential charts:
- No. of Actions On Time vs. Past Due: This chart provides insights into the timeliness of action item completion, comparing actions completed on time with those past due.
- No. of Actions Per Status: This chart provides an overview of action item progress, breaking down actions into statuses like not started, started, in progress, and completed.
- No. of Actions Per Task Type: This chart provides insights into task diversity, showcasing the distribution of actions across task types such as correction, corrective, preventive, improvement, and effectiveness check.
- Action Item Drilldown
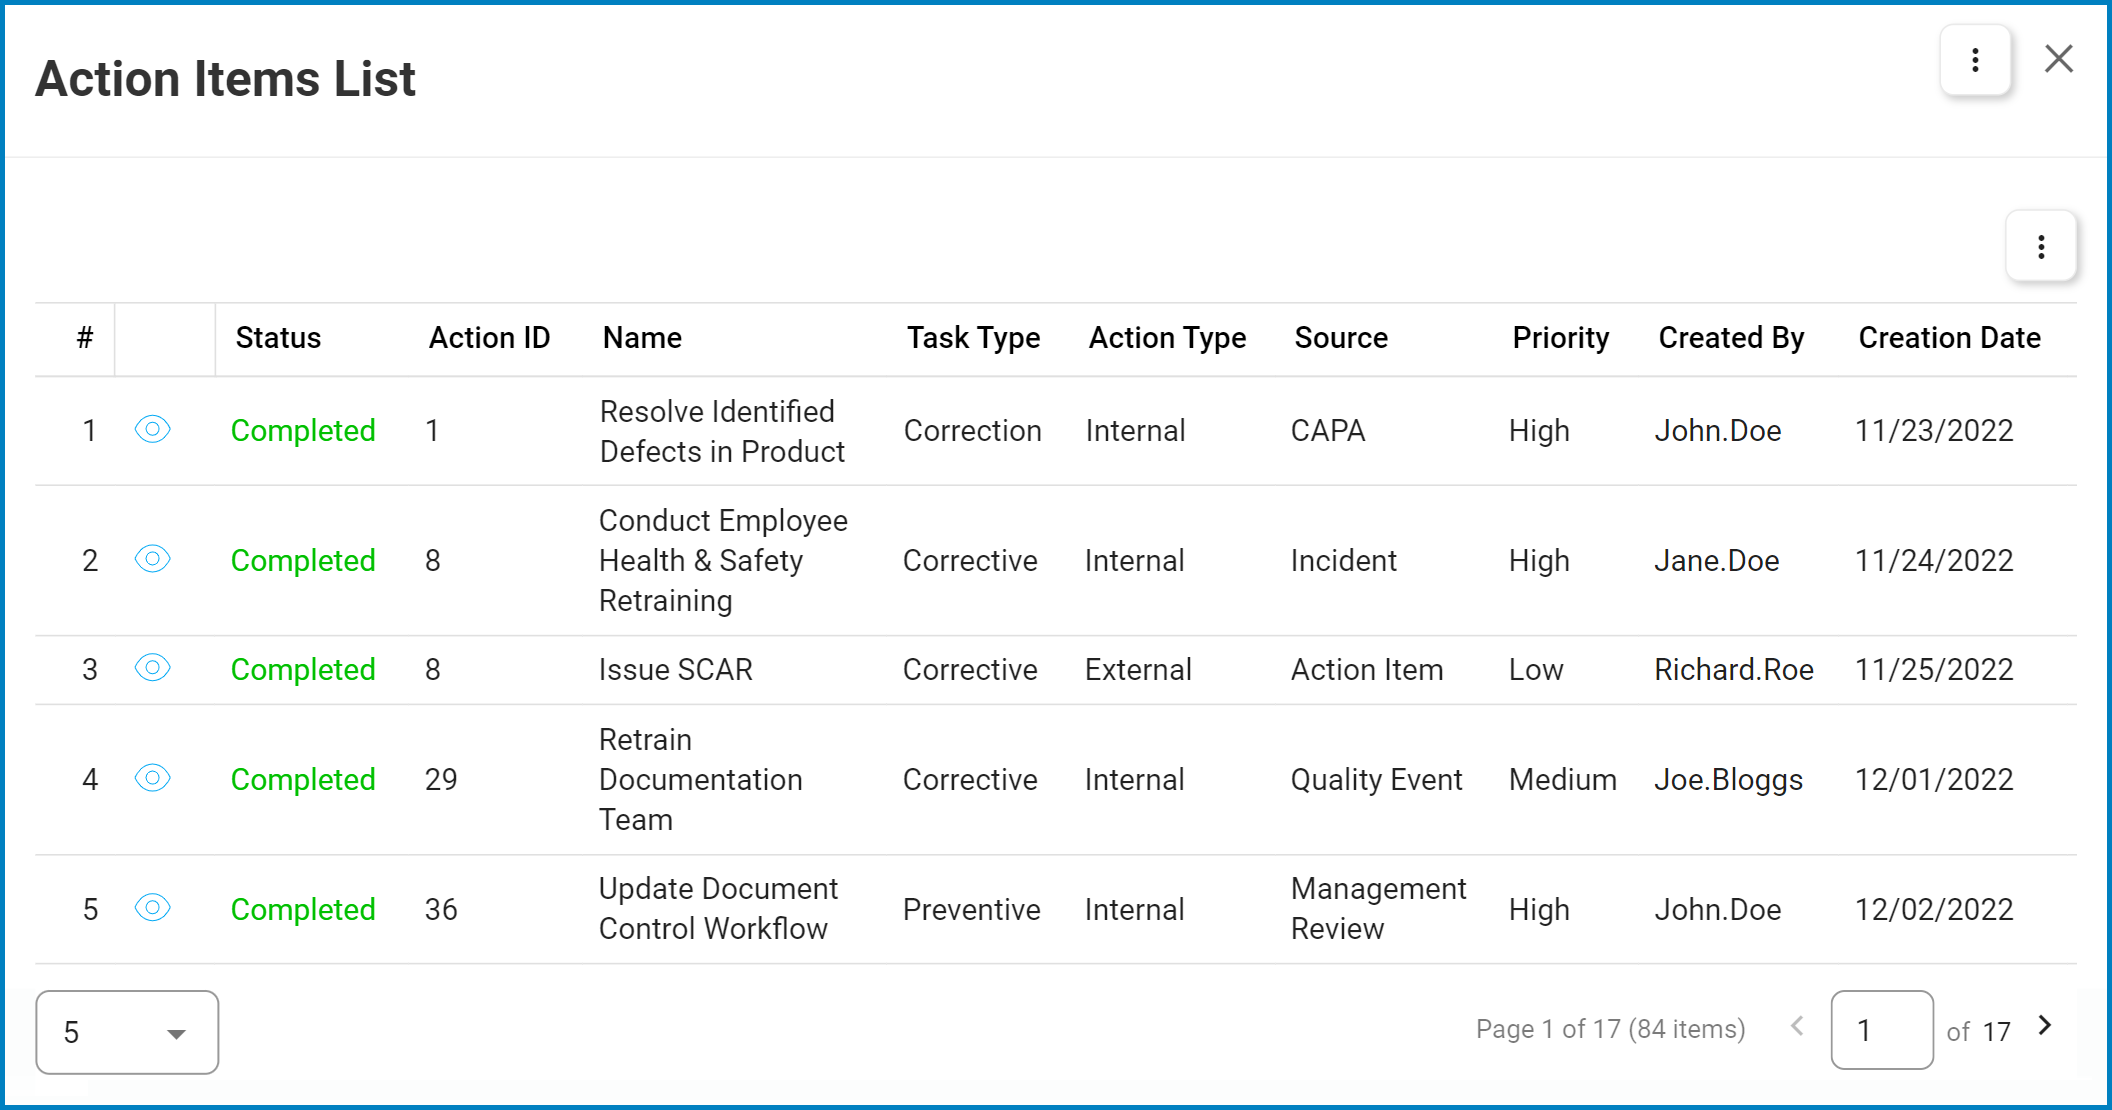
All charts in the dashboard are equipped with a drilldown functionality. This feature enables users to explore detailed information interactively, facilitating seamless navigation across different levels of data.
- To trigger the drilldown functionality for a chart, simply double-click on any of the sectors comprising it.
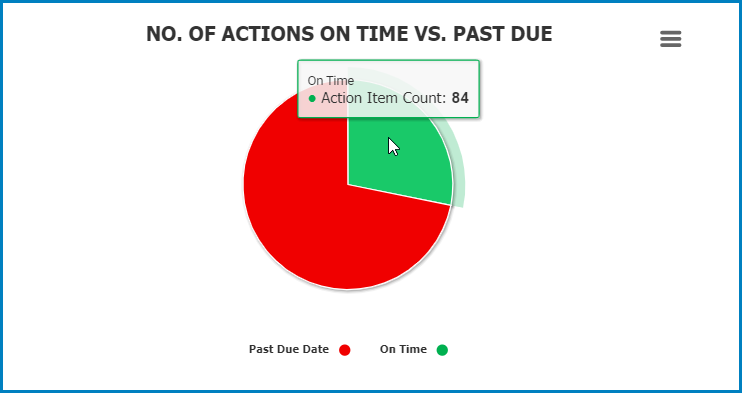
- This action will display a detailed report, allowing users to delve deeper into specific data points and enhance their understanding of action item statistics.
Post your comment on this topic.