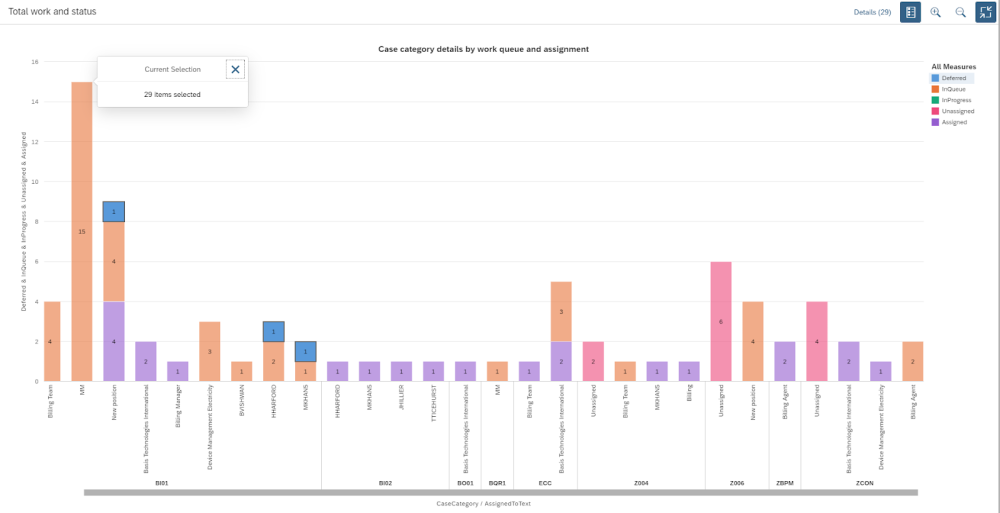
The graphic is automatically populated based on the summary view selected within the table display. The default view is Case Category Details by work queue and assignment.
This will plot the status of the cases against both the case category and the current assignment of the case.

In the menu for the graphic you can display/hide the legend using this icon
The + and – zoom icon will increase/decrease the size of the graphic. 
The expand screen icon enables you to open the graphic in full screen mode (this will provide the best quality of the data) 
Full screen mode:

In the graphic you can click on the legend bar to highlight those tabs in the bar chart.

This also brings up a new menu function for Details with the total selected. By clicking this you can see a capture of the data set.

The graphic can be collapsed to provide a full size mode of the table view or pinned to prevent the scroll bar from removing this.


Post your comment on this topic.