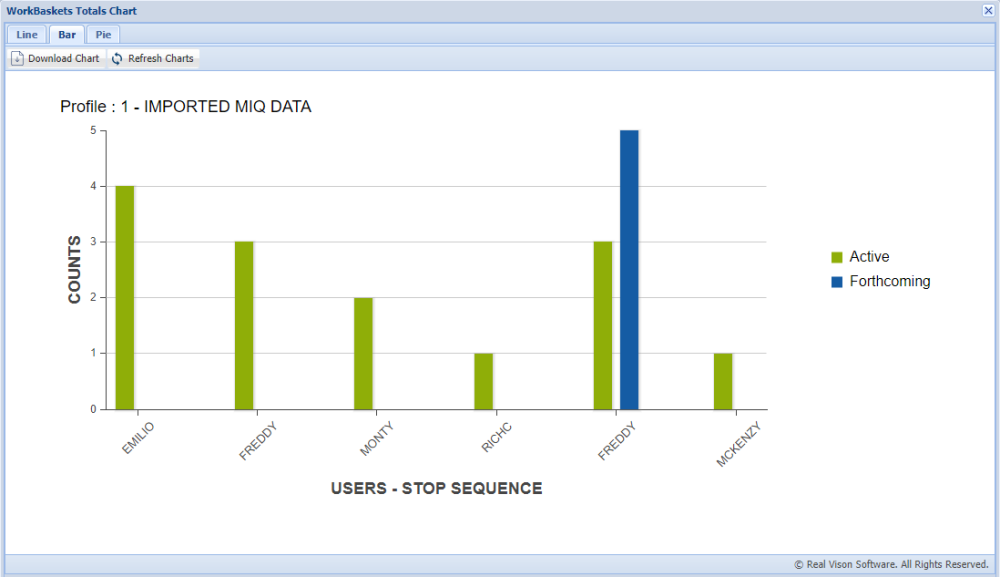
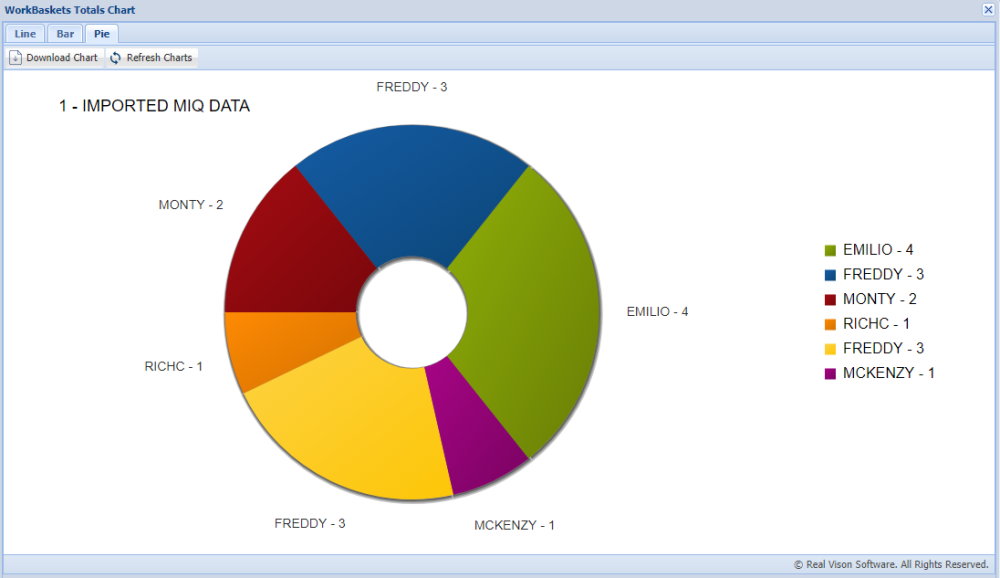
The Totals Chart is a visual representation (Line,Bar, and Pie formats) of the total items in ALL user workbaskets for the active System. The Line and Bar chart formats will display active and forthcoming items in a user’s workbasket for the active System. The Pie chart format will only display active items sitting in a user’s workbasket for the active System.
Three tabs can be found at the top left-hand corner of the window allowing users to navigate between the various chart formats. Additionally, the Download Chart button is available for saving charts to local storage. Moreover, a Refresh Charts button has been included to facilitate the reloading of data, negating the need to close and reopen the window to see updated counts.
Line Chart:

Bar Chart:

Pie Chart:


Post your comment on this topic.