
There are two charts included in this report; Projected Cash Flow and Projected Net Worth. When used together, these two charts can allow you to create meaningful discussions and outline any number of issues and solutions. Both of these charts are also included in the Charts Screen within the software.
Projected Cash Flow
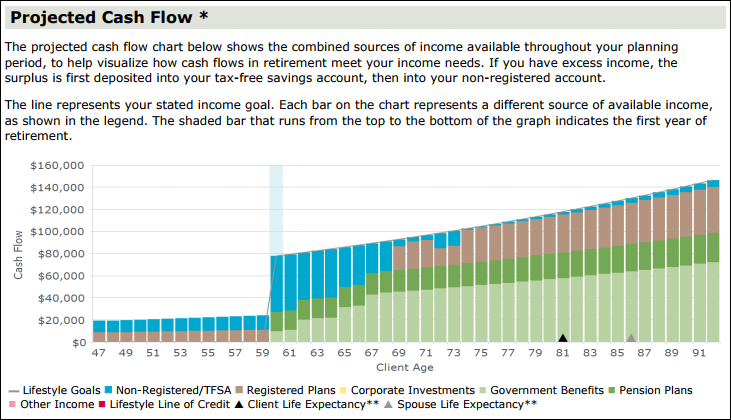
The Projected Cash Flow chart calculates the client’s cash flow from retirement on (represented by the vertical blue line). RazorPlan does not include pre-retirement cash flow within this chart and only focuses on annual investment savings pre-retirement. Based on the data entered, the Lifestyle chart will demonstrate whether a client is in an Excess or Deficiency situation. This is a direct representation of the Cash Flow Chart
Projected Net Worth
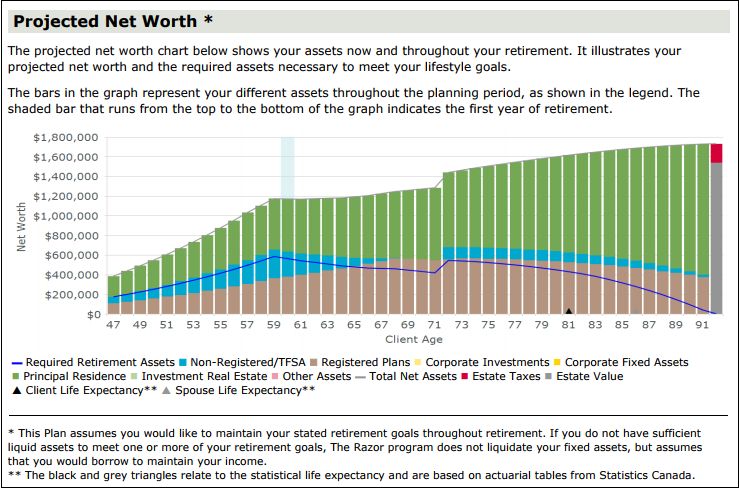
The Projected Net Worth chart demonstrates the changing value of assets throughout the analysis. The software displays all assets pre-retirement, but removes the visual breakdown of fixed assets in retirement. This approach focuses the client’s attention on the 3 most important areas; total retirement (liquid) assets, required retirement assets, and total net assets. This comparison demonstrates the difference between what they have and what they need. When combined with the Lifestyle chart, the assets chart can help further analyse an Excess or Deficiency situation. This is a direct representation of the Financial Assets Chart.
Need more help with this?
Don’t hesitate to contact us here.