
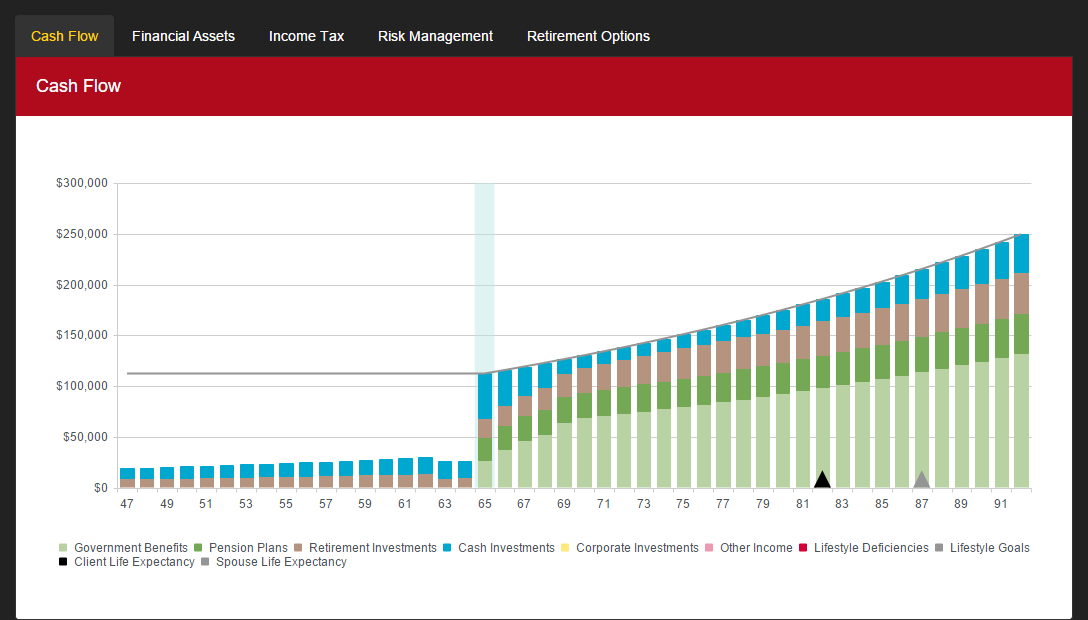
The Cash Flow chart analyzes the client’s projected retirement cash flow. This chart allows you to see whether a client will or will not run out of liquid assets at some point in the future. The end result will be a client with either excesses or deficiencies in cash-flow.
Cash Flow Breakdown
- Government Benefits – The combined value of both Client and Spouse CPP/QPP and OAS.
- Pension Plans – The combined value of both Client and Spouse pensions. Pension income will be indexed to inflation pre-retirement, and the pension indexing assumption post-retirement.
- Retirement Investments – The combined value of Client and Spouse RRSP/RRIF and Locked-In Plan withdrawals.
- Cash Investments – The combined value of Client, Spouse, and Joint Non-Registered and TFSA Investment withdrawals.
- Corporate Investments – Total Corporate Investment withdrawals, this includes both RDTOH (refundable dividend tax on hand) and dividends used to fill Retirement Income Needs.
- Other Income – The combined value of all other fixed income sources other than CPP/QPP, OAS and Pensions.
- Lifestyle Line of Credit (LOC) – Lifestyle Line of Credit amounts used to offset lifestyle deficiencies in retirement.
- Lifestyle Goals – The value of Retirement Income Needs throughout retirement. RazorPlan will look to fund this goal with the income and assets available.
- Client Life Expectancy – The client’s statistical life expectancy at retirement. This is auto-calculated based on the client’s sex, birth date and age of retirement.
- Spouse Life Expectancy – The spouse’s statistical life expectancy at retirement but is shown in the chart based on the client’s age. This is auto-calculated based on the spouse’s sex, birth date and age of retirement.
Need more help with this?
Don’t hesitate to contact us here.