
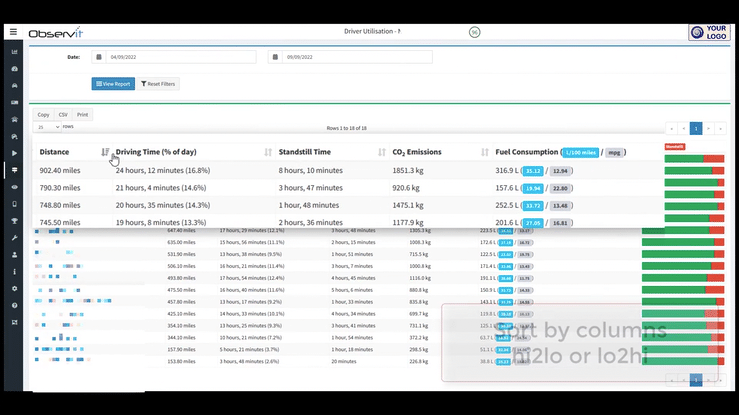
All your drivers are listed in this one table, which can be filtered and sorted as normal for our VideoMatics reports. All data entries are live (or as close to it as we can manage).

Column headings are:
- Distance driven, total driving time
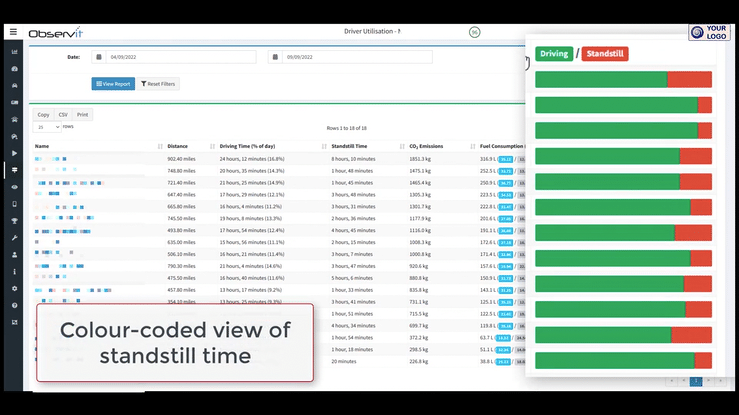
- Standstill as total & colour bar
- CO2 emissions and fuel consumption

Sort by column headings as required, or use the filters.

Post your comment on this topic.