Managed BI Portal - User Guide
Table of Contents
Managed BI Portal - User Guide
GrabGrab
GrabGrab
  • Overview
  • Login & Navigation
  • Pivot Reports
    • Creating a new report (OLAP)
      • Quick Guide: Toolbar Buttons
    • Creating a new report (Relational OLAP)
    • Creating Report Subscriptions
    • Emailing Reports
    • Graphs & Charts
      • Options: Chart Size & Position
      • Options: Chart Floor / Ceiling
      • Options: Legend
      • Options: Labels (x & y-axis)
      • Options: Miscellaneous Settings
    • Geographic Maps
      • Geo Maps
      • Google Maps Integration
    • Calculated Fields/Measures
    • Conditional Formating
      • Conditional Formatting: Standard
      • Conditional Formatting: Data Bars
      • Conditional Formatting: Gradient
    • Sparklines
      • Sparklines: Measure & Time Dimension Settings
      • Sparklines: Size & Formatting Settings
    • Setting up Filters
    • Show Top/Bottom
  • Interactive Reports
    • Report Execution
    • Exporting to Desktop
Download as PDF

Sparklines: Measure & Time Dimension Settings

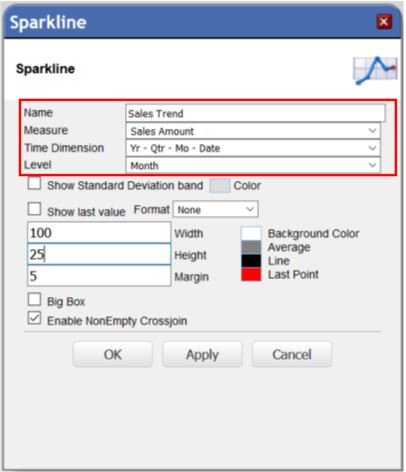
Name – Give the Sparkline meaningful name
Measure – Choose for what Measure to display trend
Time Dimension – Select your Time Attribute
Level – Select the specific component of your Time Attribute to analyze

Sparklines
Sparklines: Size & Formatting Settings
© 2016 - Decisive BI, LLC ALL Rights Reserved
Proprietary, Confidential, & Licensed for use only