
The most common method for report execution is the On Demand selection. For this method, the user opens the report navigation, selects a folder, then selects the report to render. Most often, reports are designed to display data on click. Depending on design, these reports may also open with no data displayed until the user selects prompt values.
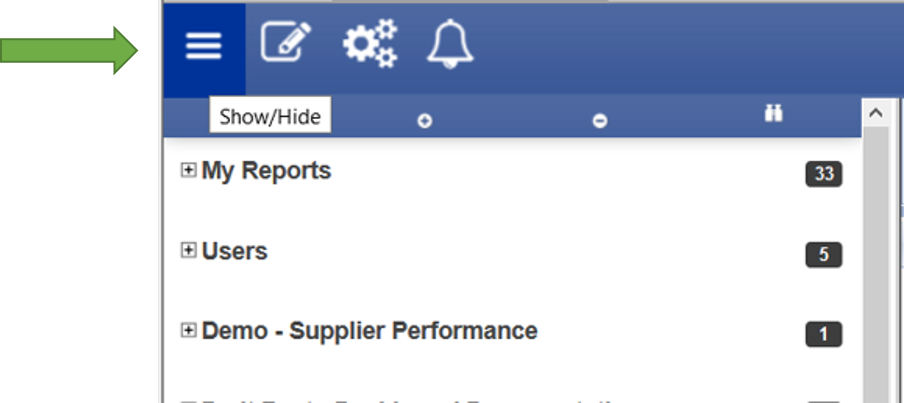
The following icon is used to open and retract the report navigation tree.
Once the tree is exposed, the user then opens the folder to show its report objects.
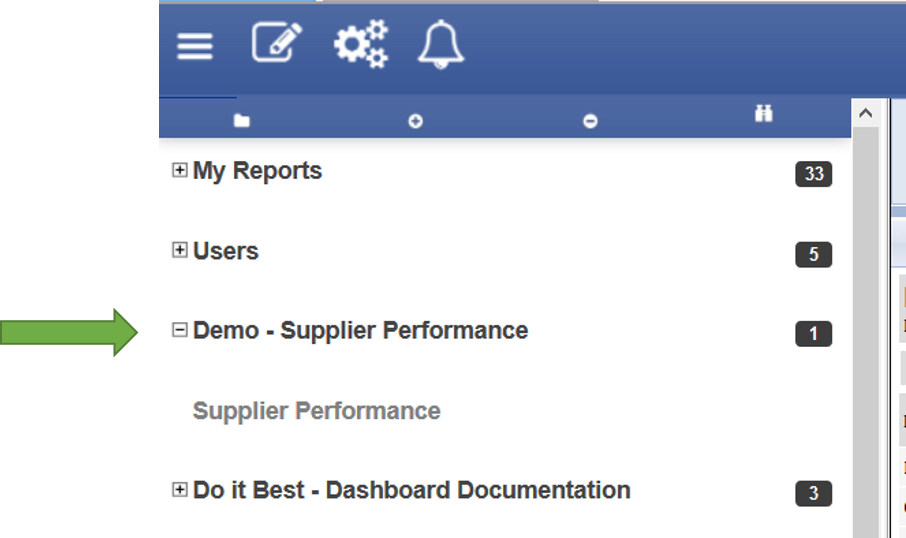
Once the reports are exposed, the user simply clicks the desired report to retrieve new data. Upon opening, the report is always refreshed using the most current data. The report has several different areas for interaction. The following image shows a standard report and the various areas that are interactive.

![]() Each report section includes filter information and where applicable, the ability to reset filters.
Each report section includes filter information and where applicable, the ability to reset filters.![]() Every hyperlink is drillable which filters the data in the entire report based on the link.
Every hyperlink is drillable which filters the data in the entire report based on the link.![]() Once an item is selected and drilled, the non-selected links gray out indicating that they are not selected.
Once an item is selected and drilled, the non-selected links gray out indicating that they are not selected.![]() If pre-configured date ranges are used, the items are available on the report for user interaction.
If pre-configured date ranges are used, the items are available on the report for user interaction.