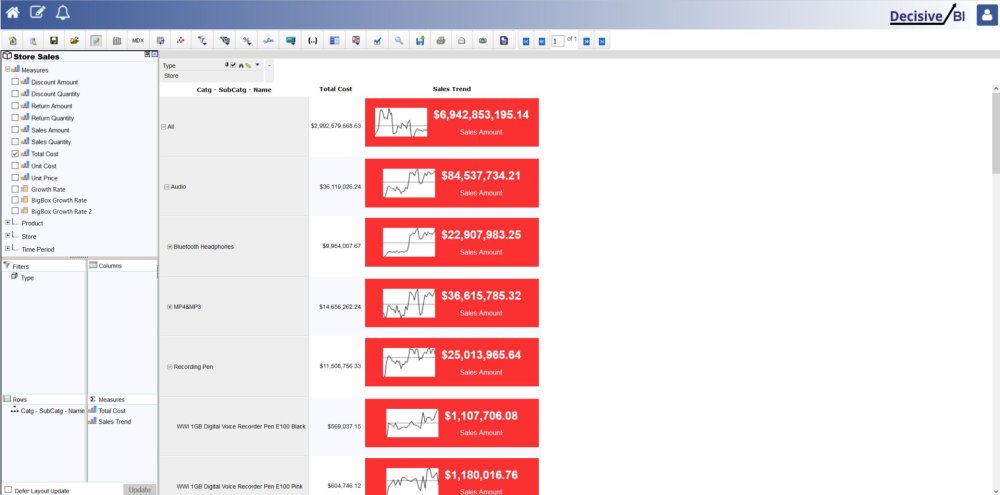
The Sparkline feature adds a level of analysis on a measure across a period of time in OLAP Reports. They allow users to visualize the time trend for measures. Sparklines are most useful when focusing on specific time dimensions.
To add a Sparkline to your Pivot Report:
- Create a new OLAP report.
- Click the Sparkline icon.
- Give the Sparkline a meaningful name.
- Select the Measure to display as the Sparkline.
- Set the formatting and size options.
- Click Apply and then OK.