

Training Center Videos will help you get started, learn “how to” use the app, understand metrics and learn from training drills – all designed to help you train smarter and get better. Also, gain actionable training drills on improving your swing.
What are the Training Center Video Groups
- Metrics Definitions
- Drills
- Strength and Mobility Training
- Training with Blast
- How to Videos
- Pro Tips & Testimonials
How to complete an Interactive Drill
- From the Progress screen, tap on Training Center
- Tap on Interactive Training Drills.
- Select a drill that has an Interactive drill icon.
- The video will play and a quick summary of the drill will be displayed below the video.
- Clipboard icon on the top right of the screen shows the layout of the drill that will be run.


- When ready to start the Drill tap the “Start Drill Now” button.
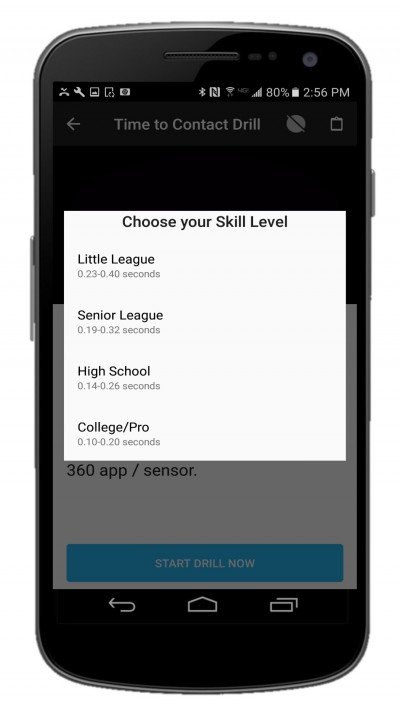
- The app will ask you to choose your skill level:
- Little League
- Senior League
- High School
- College/Pro
- The appropriate drill page will initiate and the drill will start.
- When you have completed your swings, tap on the “Finish Drill” button to get the report.
- Bats: Shows how many swings have been taken out of the suggested twenty swings.
- Stopwatch: A timer of how long the drill has lasted.
- Metric: The readout of the last swing.
- Metric Circle Graph: The bar view of where the last swing ranges in blue.
- Metric Circle Graph Goal: The green portion of the bar represents the goal range.
- Metric Goal: The skill level goal will show at the bottom of the metric circle.
- Sound: Every contact swing will give audio feedback sound for when you miss or make the selected goal. Also a feedback sound for when you hit twenty swings.


How do you get a progress report
The report provides a quick summary of your performance after completing an interactive drill. It displays the number of swings, the swings in your goal range, the duration of the drill, and an interactive graph showing all the swings. Below the graph will depict the high, average, and low metrics of the drill. To zoom in, you can pinch the graph to view metrics and tap on the circle to metrics. At the bottom of the page, additional drill recommendations will be provided.

Need more help with this?
Support Page
Powered by