
The System Report tab allows Administrators to view various types of events (such as camera streams starting and stopping) and camera stream statistics during a specified time period. This report also provides access to the Recording service system log.
Accessing the System Report
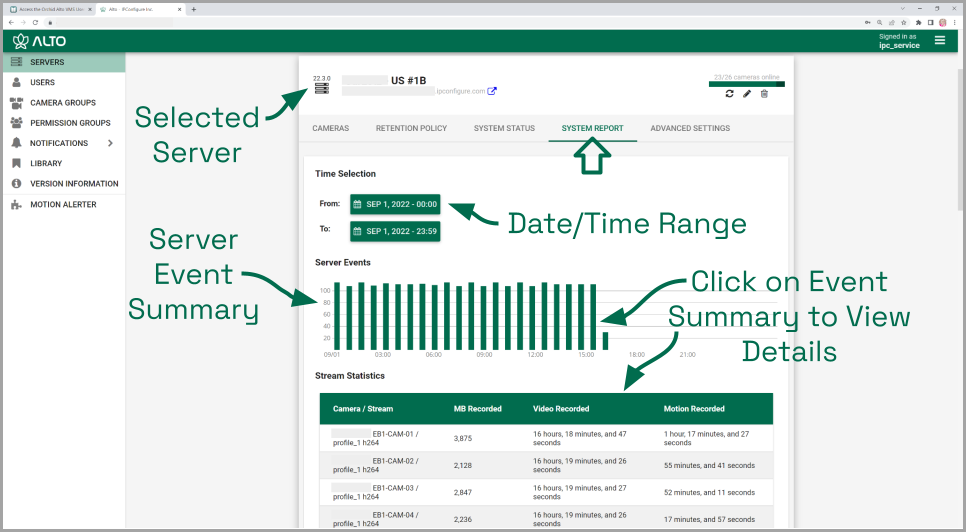
- From the Servers screen, select a server and click on the System Report tab.
Working with the Server Events and Stream Statistics
By default, the System Report will provide a report for the current date (from 12:00 AM to 11:59 PM).
- To select a new date range for the report, use the From and To buttons to select the new dates/times for the report in the pop-up calendar and then press the Go button. As soon as new dates are chosen, the report will update the Server Events and Stream Statistics sections.
The Server Events graph will display the date and time along the x-axis and the number of events that occurred on the y-axis. For each time period on the Server Events graph, a vertical bar will appear if at least one event occurred during that time frame.
Server events include the following:
- Start: The Recording service was started. (System provides the time.)
- Stop: The Recording service was stopped. (System provides the time.)
- License Changed: The Recording service license has been added, removed, or updated.
- Trusted Issuer Created: This indicates that Orchid Alto VMS has registered (added) this Recording service.
- Trusted Issuer Removed: This indicates that the Orchid Alto VMS server has detached from this Recording service.
Stream events include the following:
- Stream-starting: The stream was started. (System provides the stream name and time.)
- Stream-error: The stream posted an error. (System provides the stream name, time, and error message.)
- Failover Failed: The stream encountered a storage device failure. (System provides the stream name and time.)
- To view specific details on server events, click on any of the vertical bars. (The selected bar will appear in red.) The server event details for the selected time period will appear in a table beneath the graph.
- If there are multiple events within a selected time period, you may double-click on the vertical bar to zoom in for more detail on the time frame.
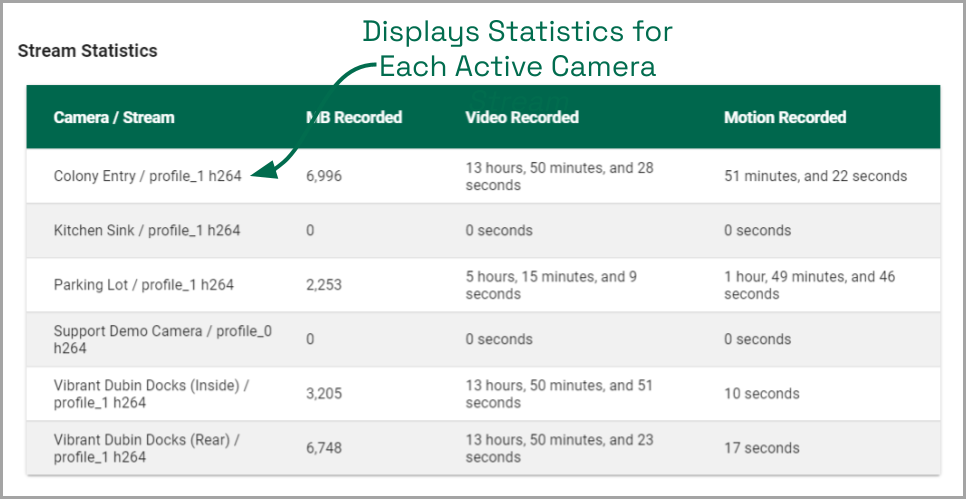
The Stream Statistics section lists each of the active camera streams in the Recording service. For each stream, the Recording service will show how many megabytes of video was recorded, the length of the recorded video, and how much of the recorded video contained motion.
Working with the Log Export
The bottom half of the System Report includes the Log Export feature. This feature allows you to view and export Recording service system logs into a compressed file or plain text. These logs contain advanced troubleshooting information and are useful when trying to diagnose issues with the Recording service.
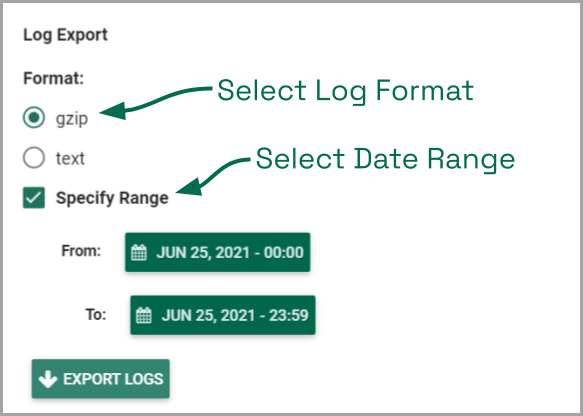
- Select the format you wish to use for the log export:
- gzip: This option will download the latest log from the Recording service into a compressed file, allowing it to be viewed on other computers. The gzip-compressed file can be extracted using the gunzip command on Linux or a utility such as 7-zip on Windows.
- text: This option will display the log within the browser without downloading any files. This file is likely to be very large when a narrow date range is not specified.
- To specify a date/time range for the log, mark the Specify Range checkbox. Then use the From and To buttons to select the start and end dates/times.
- Once your selections are complete, click the Export Logs button.
Post your comment on this topic.