
Users can customize Map Graphs to display specific items, allowing users to better view and analyze business processes. There are a variety of customizable features, which can be located in the options section denoted by  icon.
icon.
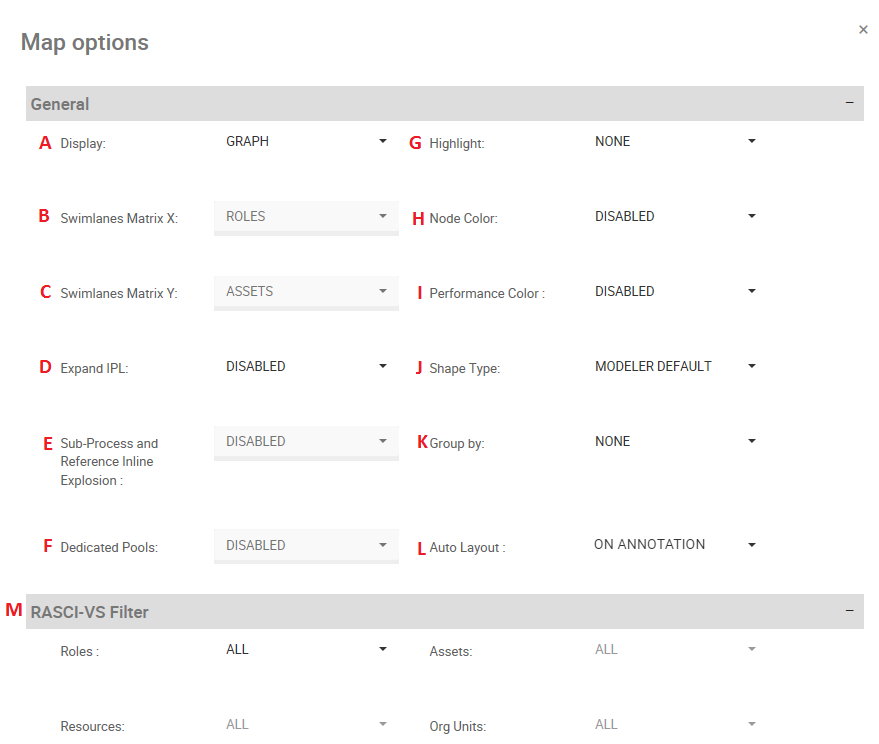
Customization Options
| Item | Setting | Purpose |
|---|---|---|
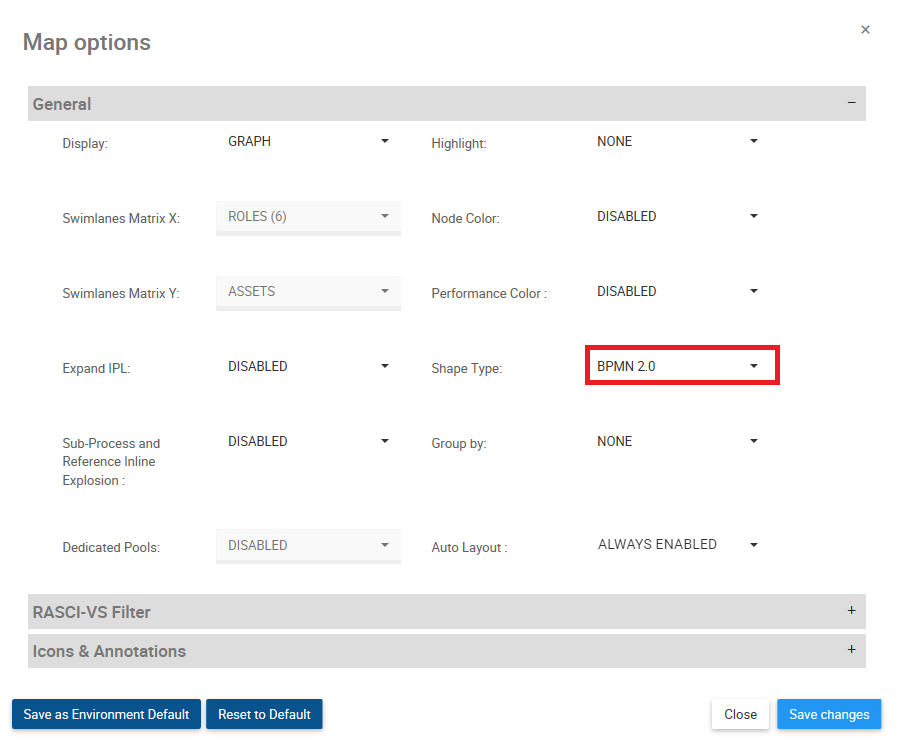
| A | Display | Allows users to toggle between Graph formats (Graph View, Swimlanes, Matrix Swimlanes, Process Preference) |
| B | Swimlanes Matrix X | Select item to be feature on Swimlane X-axis (Matrix Swimlane only) |
| C | Swimlanes Matrix Y | Select item to be feature on Swimlane Y-axis |
| D | Expand IPL | Allow user to automatically enable IPLs expansion |
| E | Sub-Process Inline Explosion | Allows users to enable sub-processes expansion within a current process map |
| F | Dedicated Pool | Allows users to isolate specific roles, resources, assets and org units into separate swimlanes |
| G | Highlight | Allow user to highlight specific paths (Critical Path, High Risk Path, Value Added, My Tasks, Manual vs. Automated) |
| H | Node Color | Allow users to enable or disable pre-set node colors |
| I | Performance Color | Allow users to enable or disable pre-set performance colors |
| J | Shape Type | Allow users to toggle between process viewing formats (BPMN 2.0, Simple BPMN, VSM, Modeler Default) |
| K | Group By | This section allows users to classify process and flow items into categories (e.g. Core Process vs. Support Process) |
| L | Auto Layout | Allow users to users to enable auto-layout on click, on annotation or have the setting constantly applied |
| M | RASCI-VS Filter | Allow users to prioritize items being displayed using the RASCI-VS matrix |
| N | Icons & Annotations | Allow users to dictate which items are displayed and how they are displayed (Icon, Annotation, None) |
A. Display: The Display feature allows users to toggle between Graph, Swimlane and Matrix Swimlane views.
To use the Display option, please see the steps below:
1. Select “Options” icon 
2. Navigate cursor to Display bar
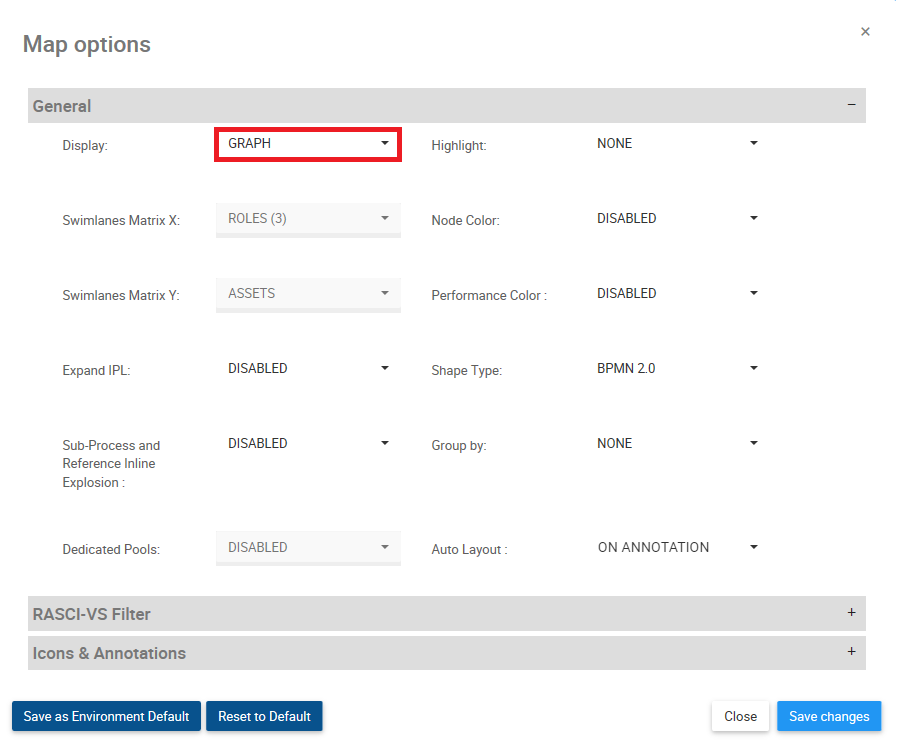
3. The following drop-down menu will be generated
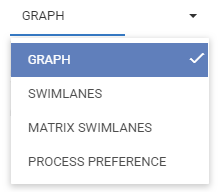
4. Select desired Graph format
5. Select the “Save Changes” button at the bottom right of the page
B. Swimlanes Matrix X: This feature allows users to set the X-axis for Matrix Swimlane Graphs.
To use the Swimlanes Matrix X option, please see the steps below:
1. Select “Options” icon 
2. Navigate cursor to Display bar
3. The following drop-down menu will be generated
4. Select Matrix Swimlanes
5. Navigate and select Swimlanes Matrix X bar
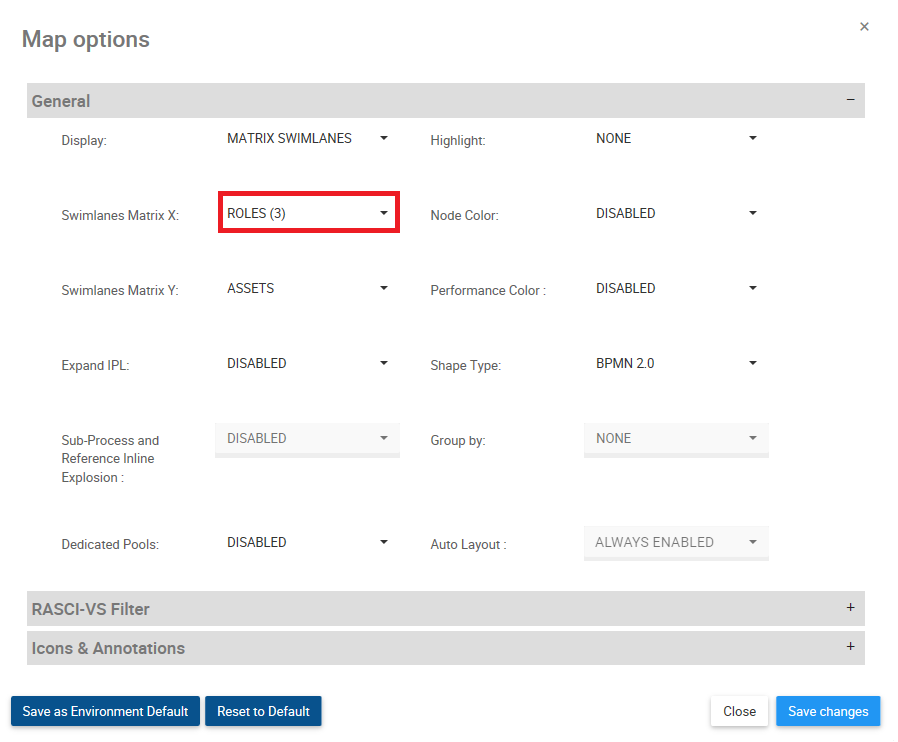
6. The following drop-down menu will be generated
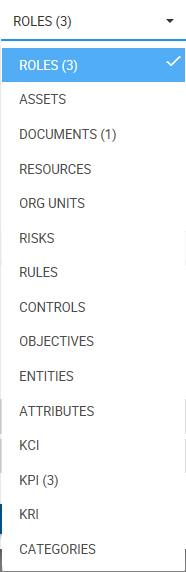
7. Select the desired item to be featured on the X-Axis
8. Select the “Save Changes” button at the bottom right of the page.
C. Swimlanes Matrix Y: This feature allows users to set the Y-axis for Swimlane and Matrix Swimlane Graphs.
To use the Swimlanes Matrix X option, please see the steps below:
1. Select “Options” icon 
2. Navigate cursor to Display bar
3. The following drop-down menu will be generated
4. Select Swimlanes or Matrix Swimlanes
5. Navigate and select Swimlanes Matrix Y bar
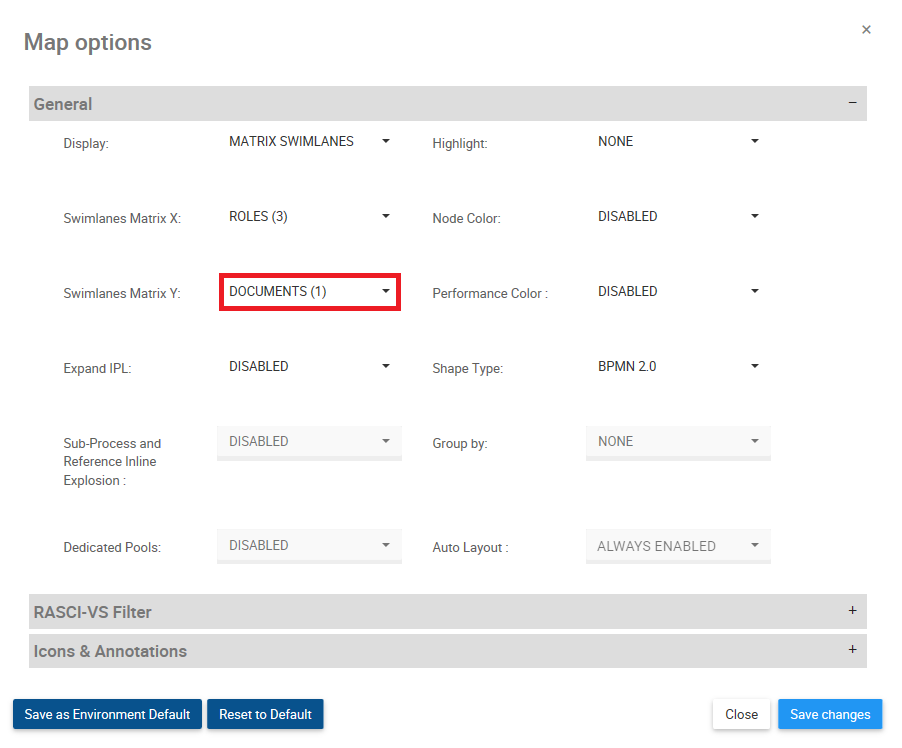
6. The following drop-down menu will be generated
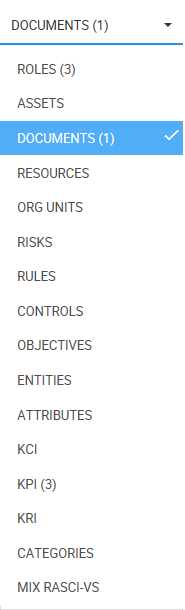
7. Select the desired item for the Y-axis
8. Select the “Save Changes” button at the bottom right of the page.
D. Expand IPL: This function allows users to expand Inter-Process Links to view the full implication of a given process.
If enabled (YES), Expand IPL will not redirect you to the linked process, but rather expand the graph to show the current process extending into the linked process.
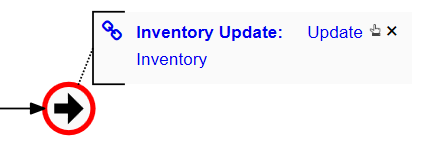
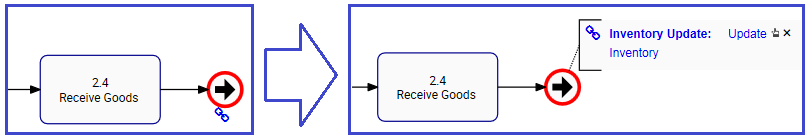
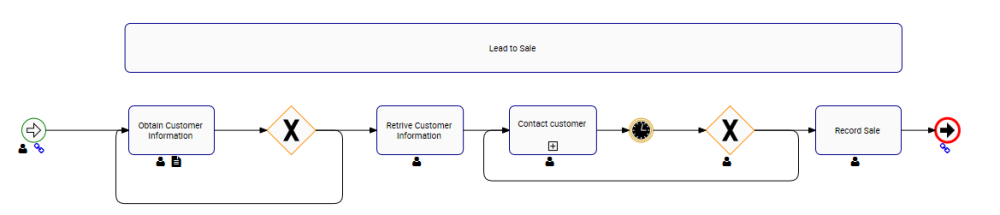
If you have enabled the IPL icon in the graph settings, you will see a  icon beneath the item having an IPL. Clicking on the IPL icon will convert it into the IPL annotation that is described below.
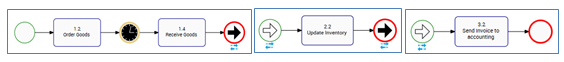
If you have enabled the IPL annotation in the graph settings or have clicked on the IPL icon, you will see an annotation as displayed below containing the process name in bold followed by the name of the task that the IPL will lead to. In this example, the linked process is named “Payment” and the linked task is named “Send invoice to accounting”. Therefore, the annotation reads “Payment: Send invoice to accounting”.
How to Expand IPL
1. Select “Options” icon
2. Navigate cursor to Expand IPL bar
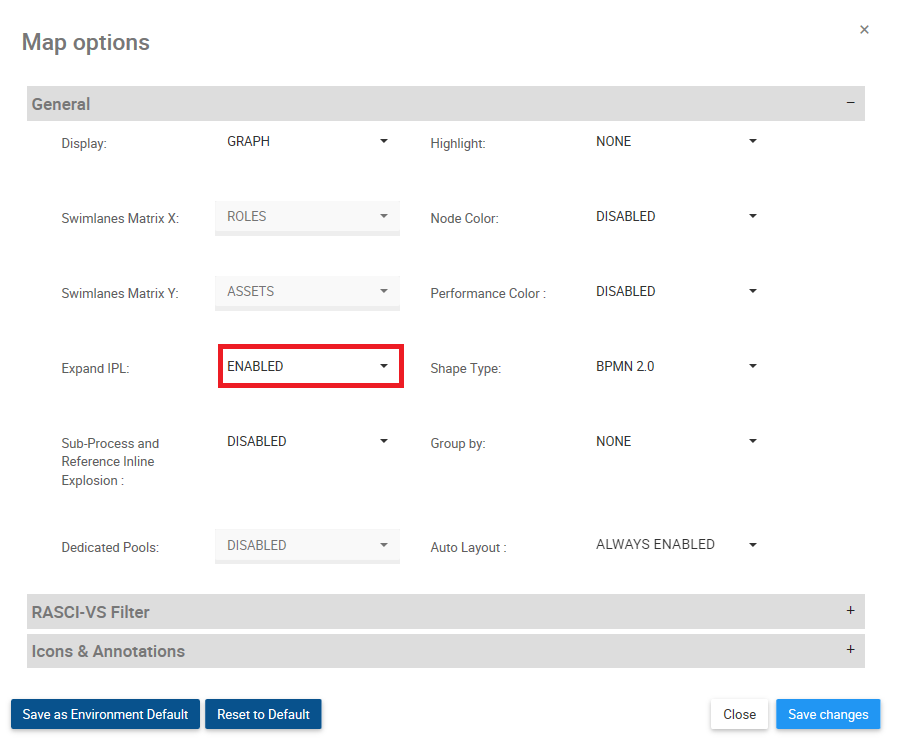
3. The following drop-down menu will be generated
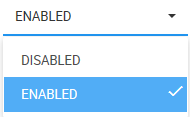
4. Select Enabled
5. Navigate to a process. Make sure you are on a process that has an IPL to another process.
6. Make sure that you have enabled either the IPL icon or IPL annotation in the graph settings.
a. If IPL icon is enabled, click on the icon in order to display the IPL annotation.
7. Click on the blue text of the IPL annotation.
8. The process will now expand to incorporate all flow objects of the linked process.
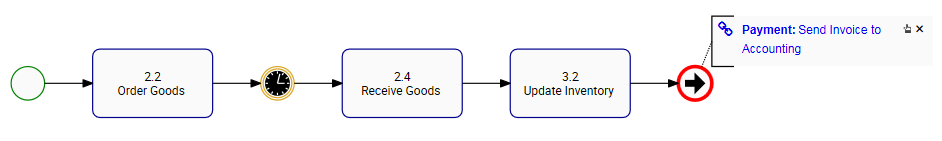
a. You can continue expanding IPL’s, click on the “Payment: Send Invoice to accounting” of the currently expanded process to expand it to the next linked process.
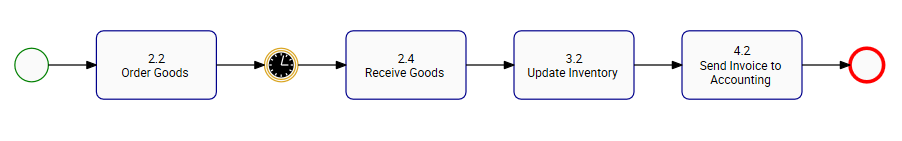
9. The process will now expand to incorporate all flow objects of the linked processes.
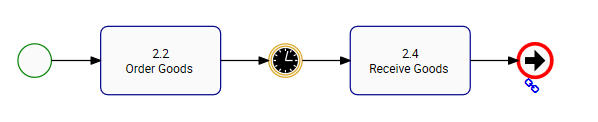
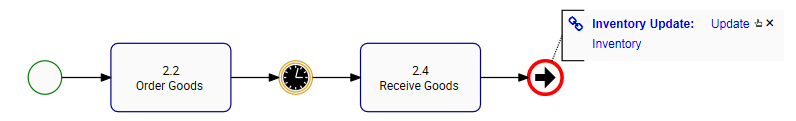
Below is an example of three (3) processes that are linked together via IPL.
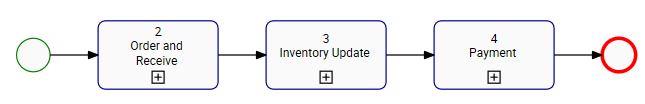
Below are the three processes displayed in line, where no IPL has been expanded yet. Notice that they all have start and end events, and those that have IPL’s are displaying the icon.
G. Highlight: The highlight function allows you to highlight the Critical Path, the High Risk Path, or tasks that are Value Added. Addtionally, tasks to which a resource or a role that is linked to your user account can be highlighted and manual vs. automated tasks can be displayed as well.
Critical Path: The sequence of flow objects that determine the minimum length of time needed to complete the process. Flow objects on the Critical Path are manually determined and selected in the Webapp
High Risk Path: The sequence of flow objects that determine the path of highest risk throughout the process. Flow objects on the High Risk Path are manually determined and selected in the Webapp
Value Added: Flow objects that add value to the output of the process or organization. Flow objects that are Value Added are manually determined and selected in the Webapp
My Tasks [ R ]: Flow objects that are assigned to you via a resource or a role will be highlighted in the process map. Note that only flow objects for which you are RESPONSIBLE for will be highlighted.
Manual Vs Automated: Indicates the automation level of an activity. Highlighted in red are tasks which require human input (manual activity), highlighted in yellow are activities which require human input but are assisted by a system (semi-automated activity) and highlighted in green are activities which require no human input and is fully automated by a system (automated). The flow object will be highlighted depending on whether an asset, role, resource or org unit is assigned to it. Refer to the table below for the RASCI-VS assignment rules for the highlighting.
| Color | RASCI-VS Assignment |
|---|---|
| GREEN | Asset [ R ] or/and [ Su ] |
| YELLOW | Asset [ R ] or/and [ Su ] + Role/Resource/Org Unit [ R ] |
| RED | Role/Resource/Org Unit [ R ] |
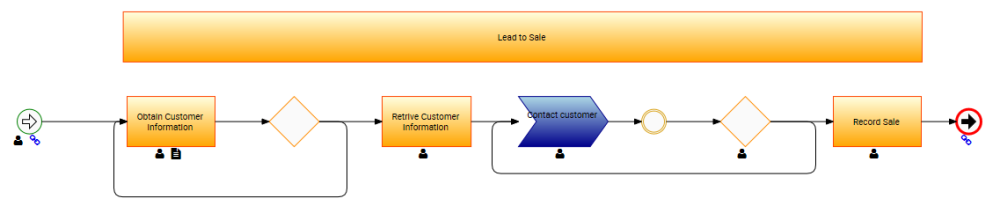
H. Node Color: If enabled, the colors that have been set on flow objects within the EPC Modeler will be displayed in the graph or swimlane.
I. Performance Color: If enabled, flow objects will adopt the color (Green, Yellow, or Red) of the associated performance indicator (KPI, KRI, or KCI). If enabled, flow objects will adopt the color (Green, Yellow, or Red) of the associated performance indicator (KPI, KRI, or KCI). See the Performances section for detailed information about Performances and their colors. If multiple performance indicators are associated, the adopted color will be based on the weights assigned to them.
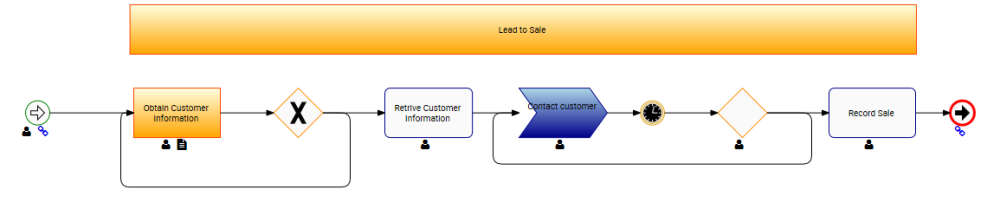
J. Shape Type: The process view allows users to toggle between different process annotations. This allows users to select the process notation they are most familiar with. Users can select the following notations
a. BPMN 2.0 (Business Process Modeling Notation)
b. Simple BPMN (Business Process Modeling Notation)
c. VSM (Value Stream Mapping)
d. Modeler Default: This view allows users to mix BPMN 2.0, BPMN and VSM shapes
To toggle between Shape Types, please see the steps below:
1. Select “Options” icon 
2. Navigate cursor and select Shape Type option
3. The following drop-down menu will be generated
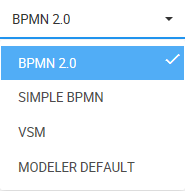
4. Select desired Shape Type
5. Select the “Save Changes” button at the bottom right of the page
K. Group By: This section allows users to classify and group different items within process maps based on environment-defined categories. These categories, wholly set and defined by environments, can allow an organization to tailor their process maps to industry and business specific circumstances such as cover processes vs support processes.
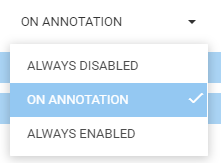
L. Auto Layout: Auto Layout allows users to generate a user friendly layout at the click of a button. Users can enable auto-layout on click, on annotations or have the setting constantly applied on processes.
| Setting | Result |
|---|---|
| Always Disabled | Auto-layout is never run. The user has to manually run auto-layout by clicking the button. |
| On Annotation | Auto-layout is only automatically run when the user expands icons to annotations or when annotations are closed |
| Always Enabled | Auto-layout is always run automatically. |
To use the Auto Layout option, please see the steps below:
1. Select “Options” icon
2. Navigate cursor to Auto Layout
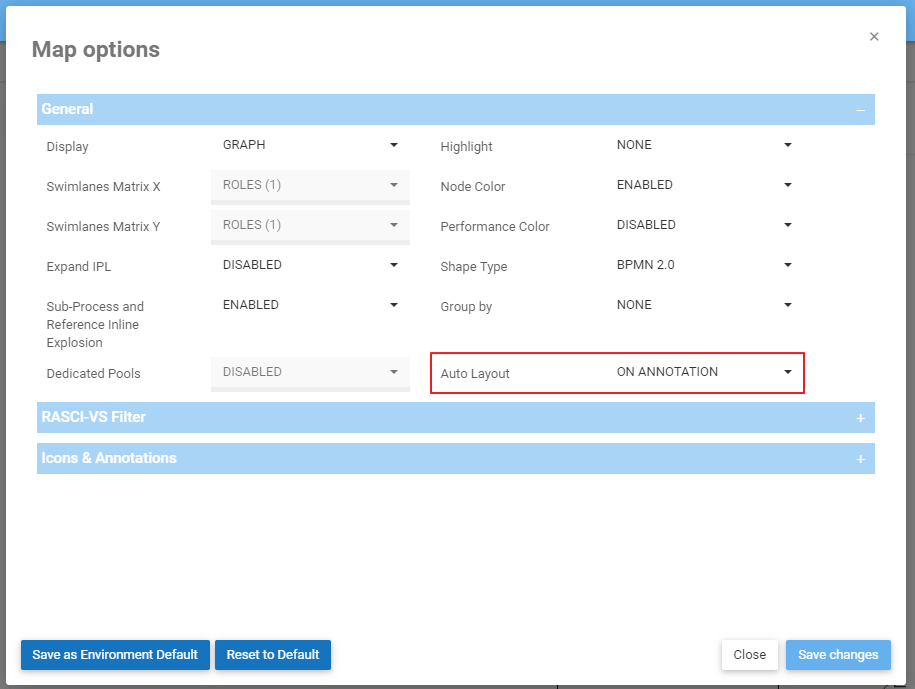
3. The following drop-down menu will be generated
4. Select desired the Auto Layout option to view a process
M. RASCI-VS Filter: The RASCI-VS Filter allows users to filter which items get displayed on Graphs based on their level of involvement. Using the RASCI-VS allows users to filter through involved parties and to understand who, what and how different items are involved in processes.
The RASCI-VS filter can be applied to the following items:
a. Roles
b. Assets
c. Resources
d. Org Units
To use the RASCI-VS Filters, please see the steps below:
1. Select “Options” icon
2. Navigate cursor to Roles
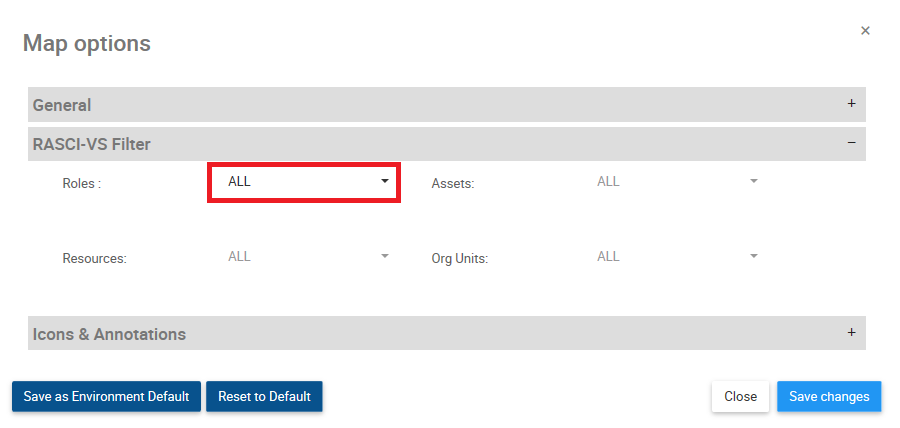
3. The following drop-down menu will be generated
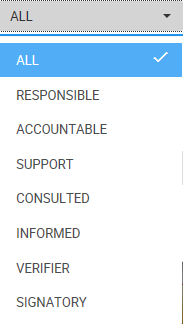
4. Select RASCI-VS filter you want to apply
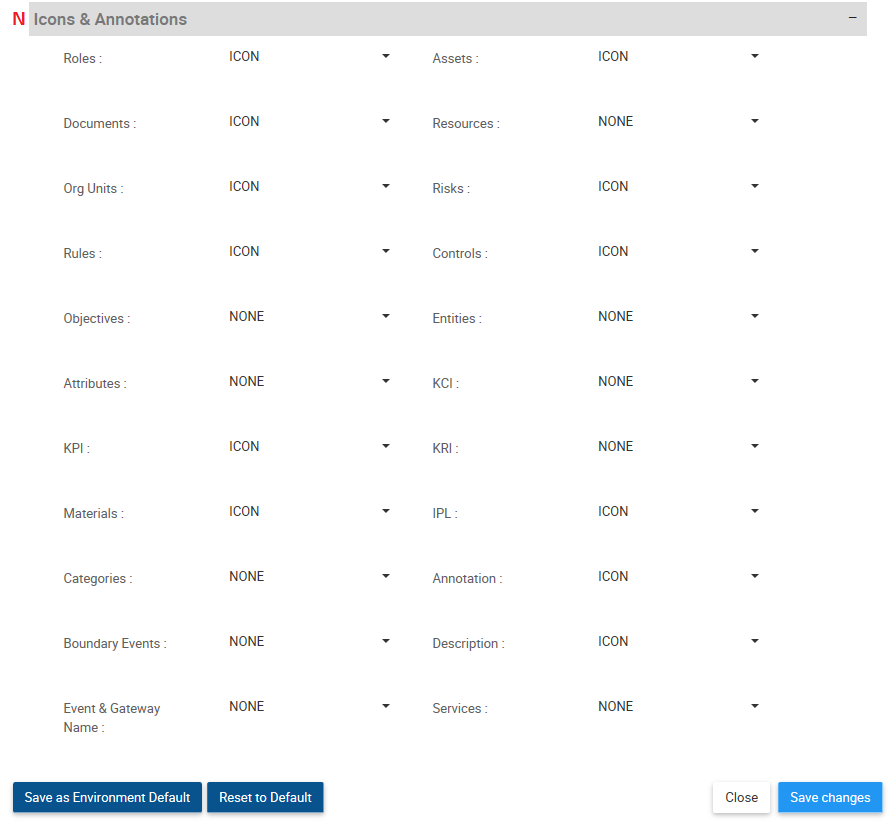
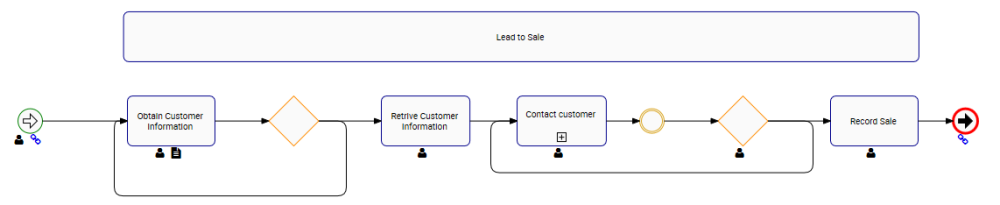
N. Icons & Annotations: The Icons & Annotations filter allows users to decide how information and items relating to processes will be displayed on the process map. The three main options are as follows
| Item | Description | Example |
|---|---|---|
| Icon | A graphical representation of a specific item in the EPC |  |
| Annotation | An expansion of Icons with full textual description of the specific item |  |
| None | An option to be selected if a user wishes to hide items from a graph |
In-Graph Icons
| Icon | Item |
|---|---|
 |
Roles |
 |
Assets |
 |
Documents |
 |
Resources |
 |
Org Units |
 |
Risks |
 |
Rules |
 |
Controls |
 |
Objectives |
 |
Entities |
 |
Attributes |
 |
KCI |
 |
KPI |
 |
KRI |
 |
Materials |
 |
IPL |
 |
Categories |
 |
Annotation |
 |
Event & Gateway Name |
How to Enable Icons & Annotations
Users can enable Icons and Annotations within “Options” section. To enable Icons & Annotations, please see the steps below:
1. Select “Options” icon 
2. Navigate cursor to Icons & Annotations section
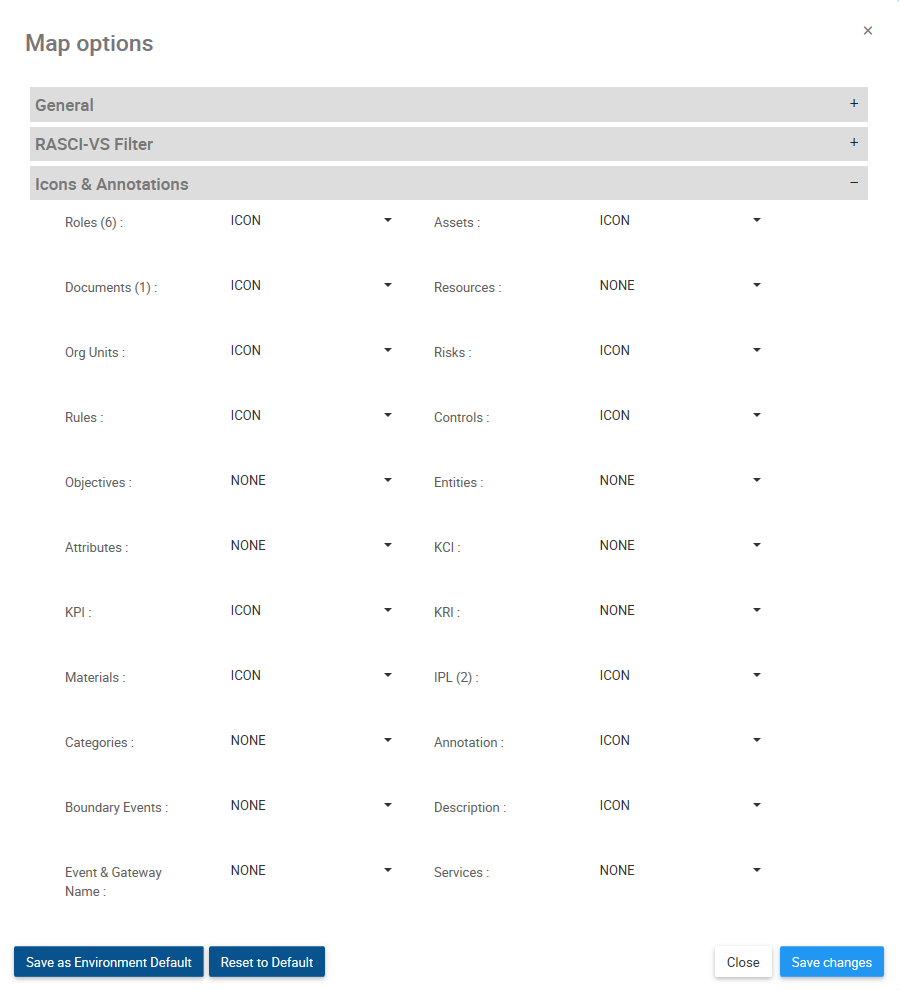
3. Navigate to the item you wish to select. For this example we will select the “Assets” item. Select the Assets bar
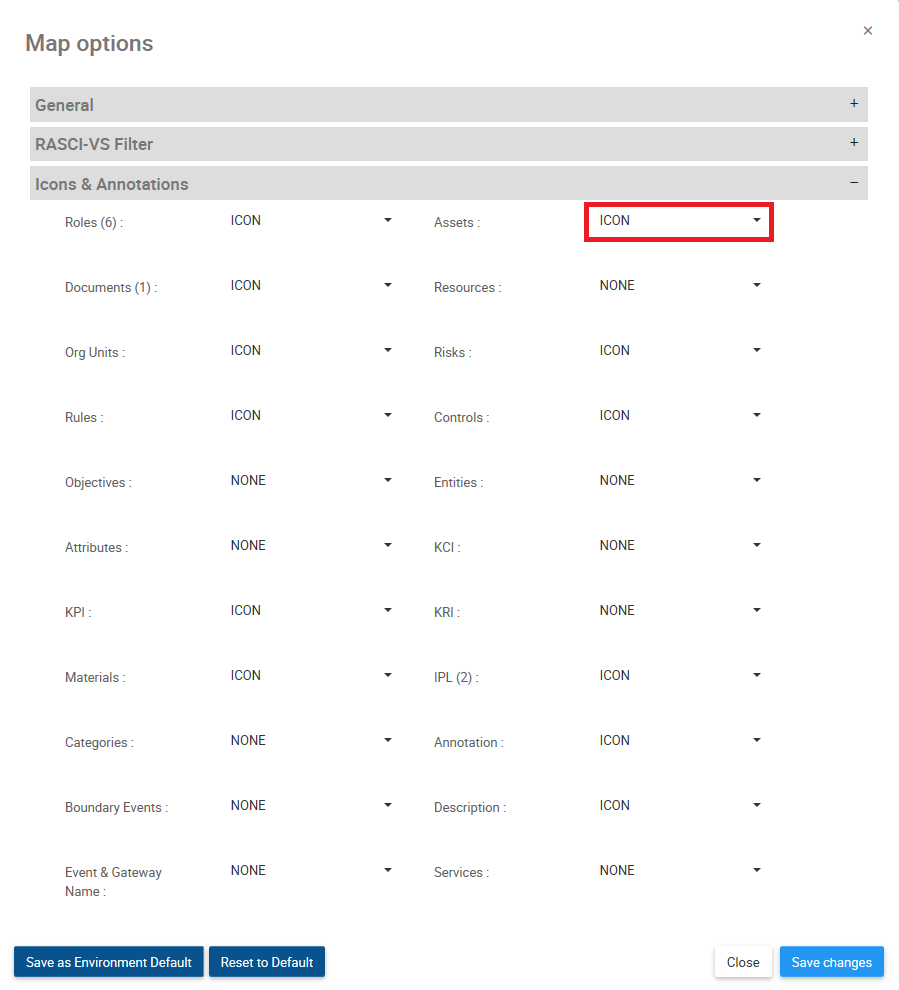
4. Clicking on the bar will generate the following drop-down menu
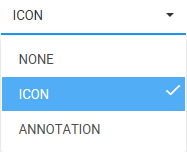
5. Select the desired notation and click the “Save Changes” at the bottom right of the page.
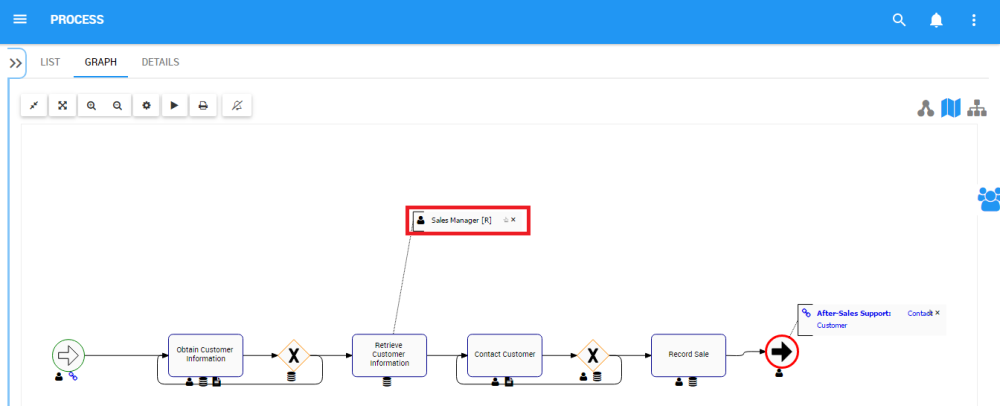
How to Re-Organize Annotations
The EPC allows users to shift the position of Annotations within a Graph to optimize viewing capabilities. Users can reorganize annotations based on a pre-set placement options, or personalize their map through personalized map customization.
To use the Pre-Set Placement options, Please see the steps below:
1. Enable Annotations for a particular item
2. Click on the Annotation that you wish to reorganize. The item in question will be highlighted as follows

3. A user can select 1 of 8 positions to move the annotation. The graphic below highlights the 8 available options
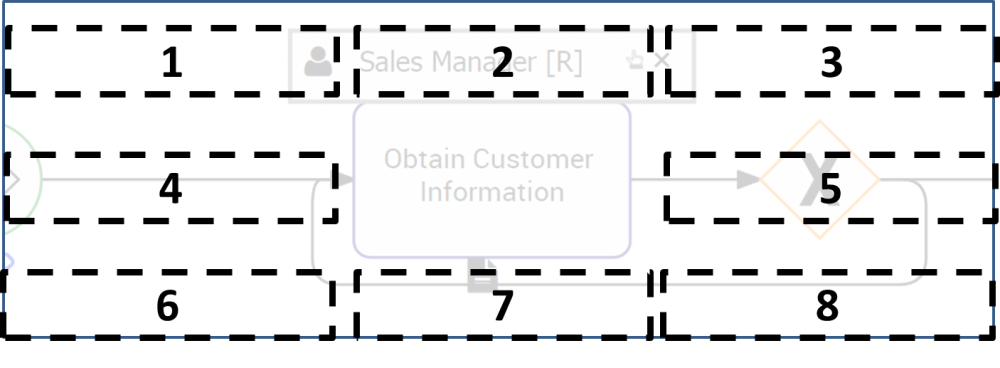
4. Click and hold the Annotation. Drag it to the desired location
To user Personalized Map Customization, please see the steps below:
1. Enable Annotations for a particular item
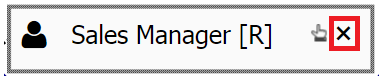
2. Click on the Annotation that you wish to reorganize. The item in question will be highlighted as follows
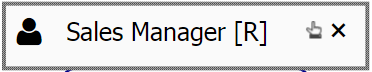
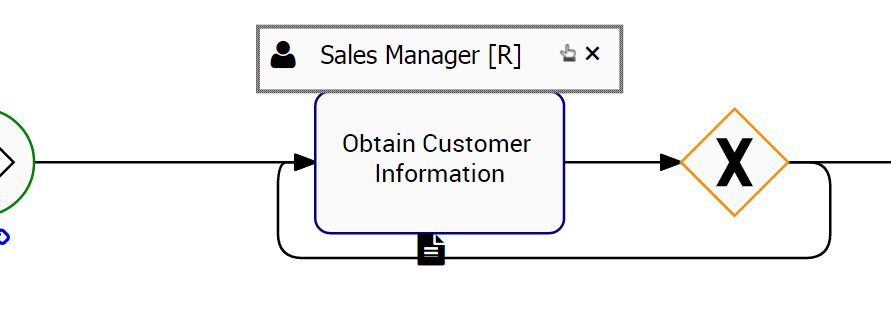
3. Select the  icon once located on the right hand side of the annotation
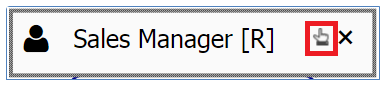
4. After clicking the  icon, it will fade and be displayed as
  . This is an indication that you have selected the item in the Map Graph and can relocate the the annotation anywhere in the graph.
5. Navigate your cursor over the annotation until the  icon is displayed.
6. Once the icon is displayed, click on the annotation and move is to the desired location on the page.
Expand Icons
The EPC allows users to manually expand Icons to Annotation format. Expanding Icons into Annotations allows users to see additional details about specific items within the process.
Please see the steps below:
1. Enable Icons for an item
2. Navigate cursor to icon
3. Double Click on the icon and it will expand into annotation format
4. You can minimize the Annotation, returning it to Icon format by clicking on the  on the right-hand side of the annotation
*Document icons allow users to preview the electronic documents uploaded in the EPC. The “Preview” button is symbolized by  icon. Simply click on the icon to preview the document.
Using Map Setting or View Setting
When you click on edit and If your user setting are different than the map’s edit settings. Then you will have options to either change your view setting to the map edit setting or keep the current view setting.
Anything different than the setting below will trigger the popup to change your default user setting to the map edit setting.
| Preference Setting |
|---|
| Autolayout: ON Annotation |
| Shape Type: BPMN 2.0 |
| Dedicated Pool: Disabled |
| Expand IPL: Disabled |
| Sub-process and Reference Inline Explosion : Disabled |
| Group by: None |
| Performance Color: Disabled |
In addition, if the swimlane for map is different than your user setting than these setting will also be changed:
| Swimlane Preference Setting |
|---|
| Assets : Responsible |
| Roles: Responsible |
| Resources: Responsible |
| Org Units: Responsible |
Need more help with this?
Visit the Support Portal