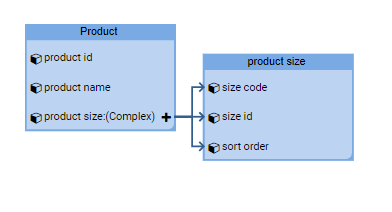
EPC users can display their Master Data content in diagram format to help users understand the relationships between Entities and Attributes.
Defining entities and attributes can help an organization describe what is important to process in an area of business. Viewing this data in a diagram format allows the analyst to easily view the associations and dependencies between entities.
Data Diagram
To view the entity-relationship diagram, follow these steps:
1. Navigate to the master data module
2. Select an entity you would like to view. Note that the ERD will only be available on an entity.
3. Select the Quick Graph View icon 
4. Select the ERD icon 
5. You will be navigated to the entity’s ERD. The entire set will not be fully displayed upon initial navigation and will display the individual item selected.

6. To further expand components of the ERD, double click on the “+” on the objects in the Graph. This will expand the ERD based on associated primary/foreign keys.

Need more help with this?
Visit the Support Portal


