
In this section, users can access visual representations of training statistics.
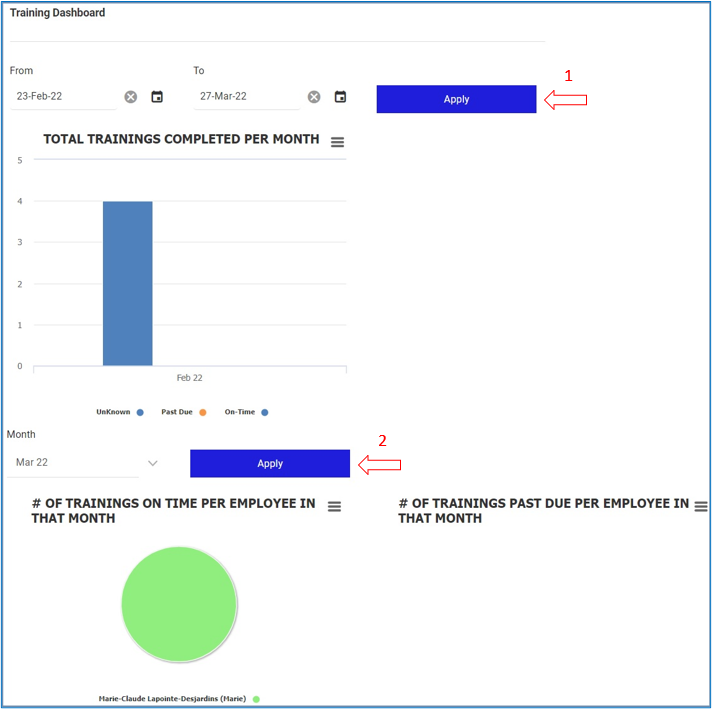
- From: This is a date field that allows users to select the From date.
- To: This is a date field that allows users to select the To date.
- Apply (1): This button filters the results according to the selected date range.
- Month: This is a single select dropdown field that allows users to select the month. It allows users to select only one value at a time from the dropdown.
- Apply (2): This button filters the results according to the selected month.
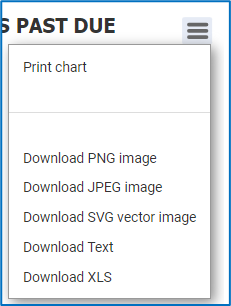
- Chart Context Menus: These are hamburger buttons which, when collapsed, display a list of options that allow users to either print or download the chart.
- Icon:
![]()
- If selected, it will display the following menu:
![]()
- Icon:
Post your comment on this topic.